Sep 24 2011
How do Gig Harbor home sales compare?
How do Gig Harbor home sales compare?

Closed home sales figures for august rose nearly 10% over last year in Gig Harbor but that was substantially less than Pierce County which experienced a 35% increase. Key Peninsula’s figures were more in line with the county at nearly 47% increase.
King County experienced a 32.7% increase in sales over last year and Kitsap 32.2%.
The increase in sales volume, coupled with a decline in inventory since last August of 13% in Gig Harbor brought the supply of homes down to the second lowest number for the year–8.4 months. the 16% inventory decline in Key Peninsula brings its supply of homes to 9.7 months–some of the lowest it has seen this year also. Absorption is figured on the number of homes currently listed selling at the last month’s sales rate.
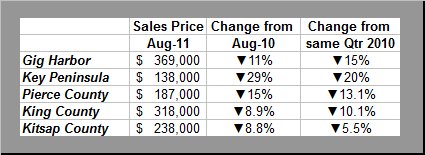
The good news was short lived however as the median sales price fell once more–down 11% from a year ago–$415,000 to $369,000–in Gig Harbor and down 15% for the quarter over the same period in 2010.
Key Peninsula prices fell even more–29% from last August–$194,000 to $138,000 with a quarterly decline of 20%. All but two months in 2011 have been at 2003 prices.
In comparison, Pierce county’s sales price tumbled 15% from a year ago, while Kitsap and King counties experienced a smaller decline of less than 9%.
Carole Holmaas is a Broker at Windermere Real Estate/Gig Harbor, licensed since 1967. She may be reached at 253.549.6611 or carole@ISellGigHarbor.com.