Jan 30 2017
Gig Harbor home prices rise nearly 24%. But the devil is in the details!
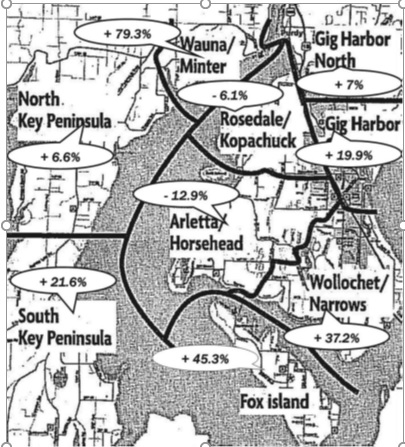
Gig Harbor home prices rise nearly 24%. But the devil is in the details! The median sales price for Gig Harbor and Key Peninsula combined is up nearly 24% year-over-year for 4th quarter. $393,000 tops the $353,000 from a year ago. I used the full quarter of statistics to equalize any single month’s velocity. And I used the end of the year to most represent the current market. But details for each area vary widely.
New construction dominates close-in Gig Harbor home prices, including the booming area surrounding Costco as well as Rosedale. Fox Island and Wollochet statistics are heavily weighted from waterfront sales. And a drop in distressed sales had a major impact for some of Key Peninsula home prices.
Gig Harbor–New home sales captured 41% of all sales, pushing the Gig Harbor home prices in this area up nearly 20% to $464,000. Waterfront sales were down by half, dropping median prices to $400,000 from $836,000 in that category.
Gig Harbor North–1 of every 8 sales was a new home, predominantly in Crescent Lake Estates. That market jumped $561-730,000. Gig Harbor home prices in this area showed an uptick $500-535,000 for 7%. While waterfront prices jumped 35%, less than half the number sold.
Fox Island–Prices jumped 45% $419-609,000 overall, with waterfront prices up 30.9% –$943-1,234,000. There are many view homes on the island, which helped push up the sales price. However, a smaller percentage of the sales was waterfront than a year ago. The few new homes on the island also added to the increase.
Arletta/Horsehead–21% of all sales were new homes with the median here for Gig Harbor home prices down slightly. 50% more waterfront homes sold this year, but those sales were down in price $935-835,000. There were more waterfront sales, albeit less pricey.
Wollochet/Narrows– 35% more waterfront homes sold, boosting Gig Harbor home prices here $422-800,000, pulling up the entire market $339-465,000 for a healthy 37.2% increase overall.
Rosedale/Kopachuck–The median price dropped here, $527-495,000. 1/3 fewer waterfront homes sold and those prices were down 30% to $583,000. Overall there were just fewer sales.
Wauna/Minter–Wauna and Minter experienced a huge boom in prices –$222-398,000. Double the waterfront sales and 1/3 fewer distressed sales made all the difference for this area with a 79% increase in median price.
North Key Peninsula–Here a reasonable increase $229-244,000. A 20% drop in distressed sales was a boost.
South Key Peninsula–Here a nice comeback $190-231,000 the past year. A few less waterfronts sold but distressed sales dropped 35%, making a major difference in the median price.
Regionally, prices year-over-year 4th quarter rose 12.9% for Pierce County, 4.3% South Kitsap, and 13.8% for King County.
