Archive for the 'Gig Harbor Market Conditions' Category

Dec 25 2010

Gig Harbor waterfront sales on par with 2007

Gig Harbor waterfront sales on par with 2007

Simply for Gig Harbor waterfront sales to be at the same level as 2007 shows the increasing strength of Gig Harbor’s real estate market.  The first half of the year was down from the 2009 volume. But the Gig Harbor waterfront homes market picked up steam in July and again in September. 

This year will likely close with as many, or nearly as many sales as 2007—64. While the peak of the real estate market was 2006 and early 2007, neither year produced the highest number of waterfront sales. Sellers weren’t selling when the market was “that strong.”

The average yearly number of sales for Gig Harbor waterfront homes is 101–from 1998 through 2005. This number was consistent even during the recessionary early years of this decade. The low point was 2008 with just 40 sales followed by the second worse year 2009 with 51 sales.

Nearly half of the current inventory of Gig Harbor waterfront homes is listed over $1m. This year’s median price—half the sales above and half below—may not climb much above the $682,500 figure from last year. A few months ago it looked like this figure might increase—but not now. But simply to not decrease is positive.

 Normally Gig Harbor contributes two-thirds of the sales and Key Peninsula one-third. This year just 12% have come from Key Peninsula. I have to presume this is because buyers have had a number of less expensive options to chose from in Gig Harbor…and have not found it necessary to travel the extra miles to quality waterfront.

Sales over $1m have strengthened this year with twice as many as last year. 11 homes sold up to $1,250,000 and six above that—but only one over $2m. Two or three is the most we ever have over $2m—but the range that has been hit the hardest is the $1.5-2m…there were 10 in 2006…and one this year.

The median sales price for Gig Harbor waterfront homes as a percentage to assessed value is currently running 91%. In other words, homes are closing for 91% of the county assessor’s valuation. Homes over $1m actually sold for 104% of assessed value…a figure that changes dramatically under $1m.

For whatever it is worth, here are the ups and downs in median prices for Gig Harbor waterfront homes over the past six years:


  Median SP Chg from prior year
2004

$488k

 
2005

$680k

40%▲

2006

$850k

25% ▲

2007

$900k

  6% ▲

2008

$800k

11% ▼

2009

$683k

15% ▼

2010 Close to 2009 Will know next week
     

Carole Holmaas is a Managing Broker at Windermere Real Estate, licensed since 1968. she specializes in waterfront and view properties. She may be reached at 253.549.6611 or Carole@ISellGigHarbor.com.
No responses yet

Oct 25 2010

Gig Harbor home prices up 11.2%

Gig Harbor home prices up 11.2%

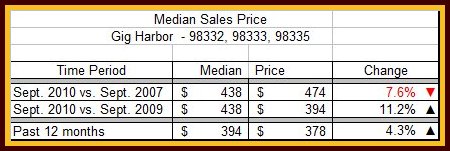
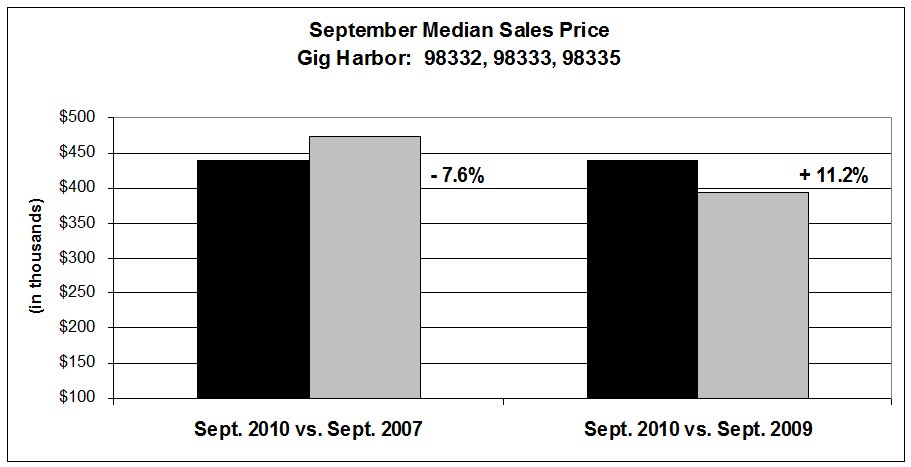
Median Gig Harbor home prices are up 11.2% from a year ago, to $438,000. Median sales price is the normal method used for trends—half the sales above $438,000 and half below $438,000. This is a better figure than Pierce County, as a whole, which trended downward just slightly in September.  These statistics represent the Gig Harbor peninsula, including Fox Island. My next blog posting will show what is happening with Key Peninsula home prices.

Even more encouraging than the year-over-year figure is Gig Harbor homes prices have trended up 4.3% over the past 12 months compared to the previous 12 months. The third quarter as a whole is also an improvement over both 2009 and 2008. These more comprehensive numbers indicate Gig Harbor home prices are making a gradual but steady climb out of the hole they were in a year ago.

 The chart shows the specifics of the changes in Gig Harbor home prices.


September Median Sales Price Table

Gig Harbor home prices


Noteworthy too, September recorded the highest median sales price of any month since June 2008—more than two years ago. Other than the 2008 date one had to look to 2007’s summer months to match or beat this September’s price.  

Sales ran the gamut—5 in Canterwood, 4 waterfront homes, 4 view homes, 4 condos, 4 in the new Chelsea Park neighborhood. The bulk of sales were in the $450-500,000 and $600-650,000 range, in addition to $250-300,000.

Sales volume is still slow—down from 2009 but nearly on a par with 2008—not yet great. There is currently a 13 month supply of houses on the market, based on September’s sales. That’s exactly what it was three years ago—September 2007–when the market turned downward–followed by 16 months often as high as 29 and 35 months supply.  A balanced market is between a 5-6 months supply.

September’s inventory of active listings is lower than it has been for this time of year. This low inventory might be giving us a false reading if there is a substantial amount of shadow inventory in the Gig Harbor market. Shadow inventory are homes foreclosed on by the lenders but not yet placed on the open market.


Sept. Median sales price 2007, 2010 chart

Gig Harbor home prices


Carole Holmaas is a Broker, licensed with Windermere Real Estate. She may be reached at 253.549.6611 or carole@ISellGigHarbor.com.

No responses yet

Aug 30 2010

Gig Harbor straddles areas poised for housing growth

Gig Harbor straddles areas poised for housing growth

Before I get to my headline…

Next week I will report on August figures for Gig Harbor home sales which appear to be an improvement over July’s anemic closings. We are set to close on target or better than 2009, with pending sales starting to flow as well. Sales include a couple more closings over 1m.

Sellers are in lock-step with nation-wide economic news though, as over 250 residences were reduced in price during the month. More next week…

Now for some good local news…

Often Gig Harbor home sales do not follow county or regional trends.  While July figures were down throughout the region and Gig Harbor, inventory did not build in Gig Harbor as in other areas.

 And for some even better local news…

Washington State–specifically Tacoma and Bremerton-Silverdale–are poised to have some of the strongest housing markets by 2014. Earlier this month Businessweek.com released a forecast of the U. S housing market, prepared by Moody’s Economy.com and the information firm Fiserv.

Bremerton-Silverdale housing prices are expected to increase 44.7% over the next four years or 9.7% annually. The area has experienced a 20% drop from the 2007 boom year. The area’s heavy military presence has kept unemployment at 7.2%, compared to 9.5% nationally, and only a fraction higher than last year. Median family income is $69,900.

The area attracts buyers looking to live close to Seattle at a lower cost in a great natural setting. The same thing can be said of Tacoma, which the study predicts will be Washington’s second strongest market with a 33.1% price gain. 15% of that is predicted to occur by 1st quarter 2012. Tacoma’s median family income is a tad lower than Bremerton at $66,200.

Gig Harbor is blessed to be straddling these two metro areas, offering some of the best schools, great parks and recreation, panoramic views, proximity to Seattle and probably the most picturesque small waterfront city in the Northwest.

Housing supply and demand in Washington, Oregon, New Mexico and Utah are in balance, according to the research, and are most likely to be undersupplied in another two years.

Carole Holmaas is a Broker with Windermere Real Estate, licensed since 1968. She specialized is waterfront and view properties and may be reached at 253.549.6611 or at Carole@ISellGigHarbor.com

No responses yet

Aug 10 2010

Sales of Gig Harbor Waterfront look a lot like 2009

Sales of Gig Harbor Waterfront look a lot like 2009

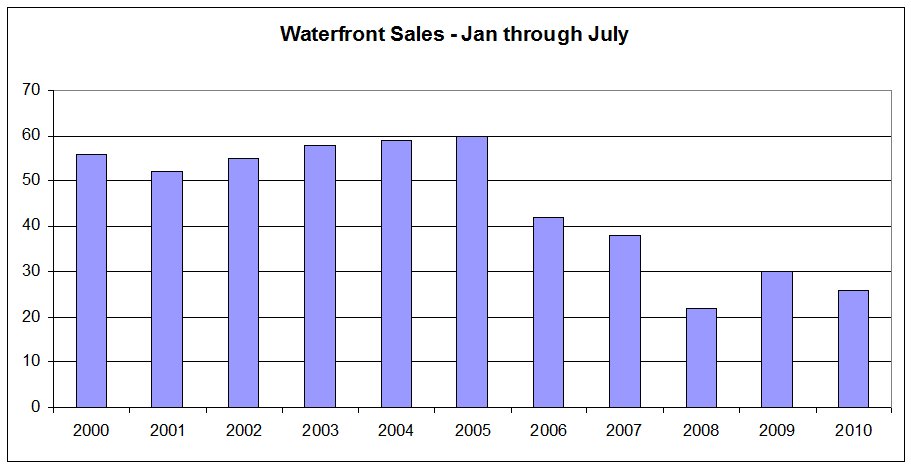
With 10 Gig Harbor waterfront sales written in July, the year is shaping up to look not as good as 2009 but not as bad as 2008—which was the worst for sales of Gig Harbor waterfront homes for decades.

Only 26 homes have closed escrow in 2010 through July. Nine of those were in June which gave waterfront Brokers signs of encouragement. But July turned around and brought only five closings. Closed sales numbered 30 at this point in 2009, with 51 sales, and 22 in 2008 when the year finished with only 40 sales.

2000-2010 waterfront homes sold Jan-July

101 sales is the average yearly number from 1998 through 2005 (just prior to the market peak when sellers “hung on” to their homes with expectations they would continue to increase in value). This number was consistent even during the recessionary early years of this decade. So 40 sales of Gig Harbor waterfront homes is abnormally low. And in 2009 when many of the high-end sales were cash, because of non-existent jumbo financing–sales barely topped 50.

Three of the July closings have been listed for 1578 days, 700 days and 537 days, respectively.

Nearly half of the current inventory of Gig Harbor waterfront homes is listed over $1,000,000. The median price is $625,000 in Key Peninsula. Normally Key Peninsula attributes one-third of all sales. This year their share is closer to one-fifth of sales.

Additionally, there is a fair amount of “shadow inventory”. These are sellers who would list their homes if the inventory wasn’t already so high…or those who have become discouraged and taken their homes off the market for a period of time. These “pent-up sellers” create something we call “shadow inventory” and they will enter the market once sales activity improves, thereby applying downward pressure on prices.

In my weekly snapshot of Gig Harbor waterfront market conditions that I prepare for my sellers and it is notable that four to six sellers have reduced their prices each week since the first of the year.


Carole Holmaas is a Broker, specializing in Gig Harbor Waterfront sales,  at Windermere Real Estate, licensed since 1968. She may be reached at 253.549.6611 or Carole @ISellGigHarbor.com.

No responses yet

May 26 2010

Gig Harbor home prices show modest sustainability

Gig Harbor home prices show modest sustainability

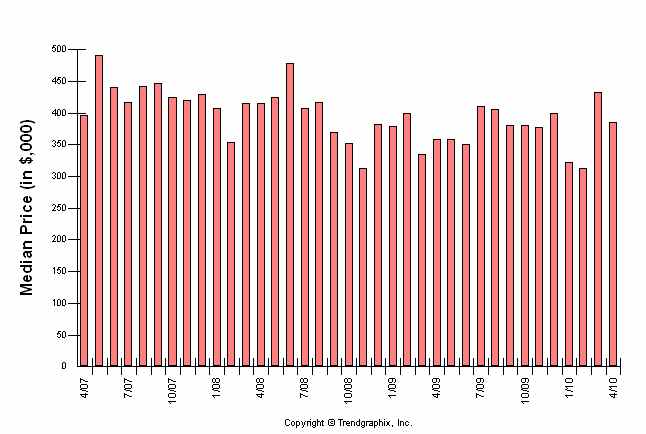
Gig Harbor home prices are continuing to sustain modest increases a third of the way into 2010, although down from March’s high of $432,000. It was evident that the March figure was an anomaly and could not be sustained; it reached back to prices the first half of 2007.

Gig Harbor home prices are up 7.2% to $385,000 over April 2009. April is the eighth of the last 10 months to show improvement year over year. Gig Harbor includes both the Gig Harbor peninsula and Fox Island.


Current 1 month     1 year     2 years  
Apr 10 Mar 10 % change   Apr 09 % change   Apr 08 % change

$385

$432

-11% ▼


$359

7.2% ▲


$415

-7.2% ▼

Prices are shown in $000’s

A wide spectrum of prices sold in April—over half below $400,000 but 27% of the sales were over $500,000, including two over $1million. I expect we will start to see higher Gig Harbor home prices as a more “normal” market takes over from the first-time buyer market dominating the last few months.

However I expect the number of sales to drop off some now that the first-time buyer incentive has expired. Sales of Gig Harbor homes have been better than 2009 for five of the last six monthsApril sales were up 34% over 2009 and 2008. Much of that activity was driven by first-time buyers as well as favorable interest rates.

With the global economy in distress, interest rates are now predicted to stay low for the remainder of this year. Unfortunately the substantial volume of foreclosures will continue to keep Gig Harbor home prices down—a trend likely to persist into 2011 or beyond.

Inventory continues to drop—last month down 4% from a year ago and 17% from two years.

The chart shown for Gig Harbor home prices includes both single family and condos.

 Gig Harbor Home Prices


Carole Holmaas is an Associate Broker at Windermere Real Estate and licensed since 1967. She may be reached at 253.549.6611 or Carole@ISellGigHarbor.com. Her posts on real estate conditions may be read at http://blog.ISellGigHarbor.com
No responses yet

« Prev