Jun 28 2017
Gig Harbor home prices—is it a seller’s market? Yes…and No!
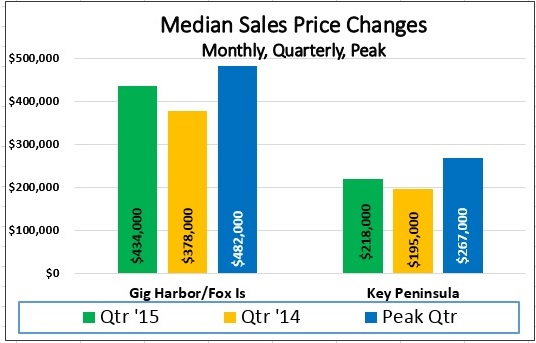
Gig Harbor home prices—is it a seller’s market? Yes…and No! While reports of current home sales indicate it is a seller’s market, that is not completely accurate for Gig Harbor and Fox Island. While it is true for much of the Puget Sound, it is a bit different where 72% of homes listed is above April’s median selling price of $500,000. This is a “dual market” for Gig Harbor home prices. Extremely low inventory under $500,000 has created a seller’s market with only 1.2 months’ supply. Multiple offers are common in this market and successful buyers will be well prepared with financing pre-approval lined up.
Months’ supply is calculated by dividing current inventory by the number of contracts accepted (pending) for the previous month. For April, it would take 1.2 months to sell everything on the market listed under $500,000.
In the $500-750,000 Gig Harbor home prices the inventory is still tight at 1.9 months and is only slightly better at $750-1,000,000 category with 2.5 months.
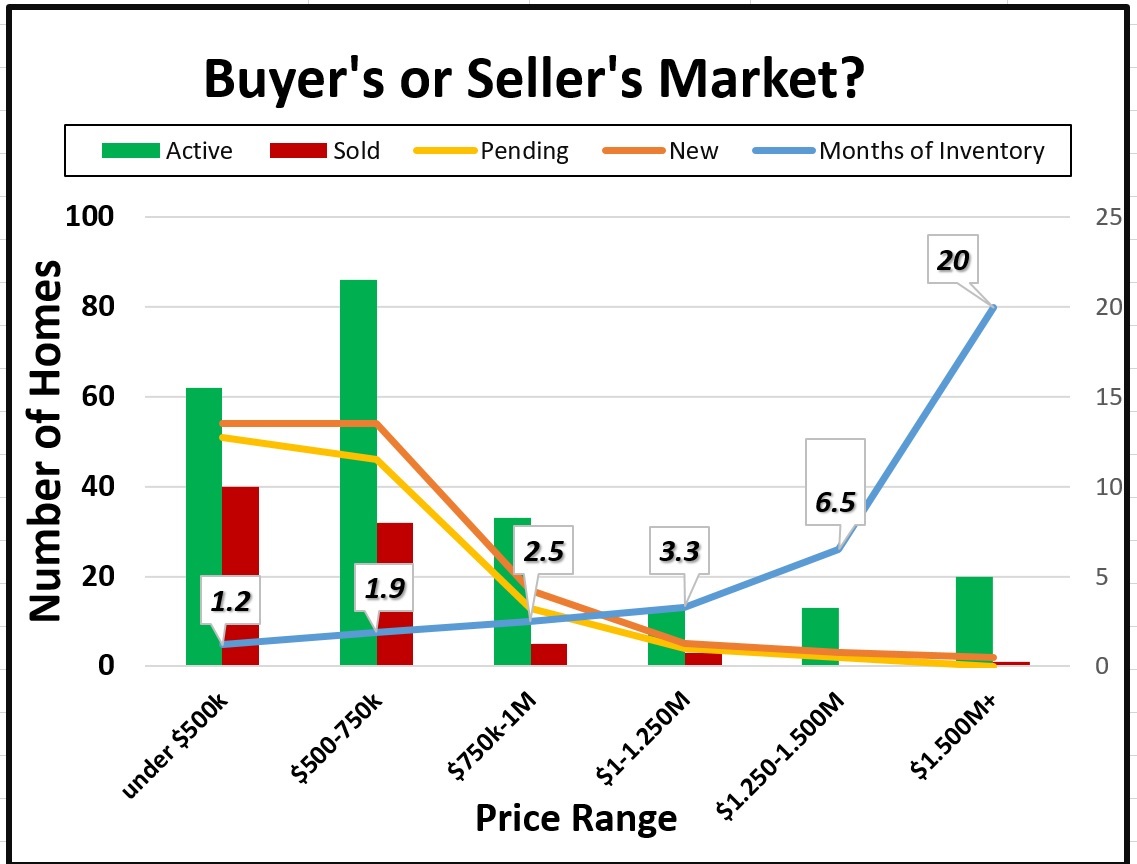
But once above $1M, buyers have a bit more breathing room and likely won’t face a bidding war for Gig Harbor home prices.. Up to $1,250,000 homes will remain on the market a bit longer, providing a 3.3-month supply and an opportunity for the move-up buyer to sell in a seller’s market and buy up in a buyer’s market.
Above $1,250,000 it jumps rapidly to a buyer’s market for Gig Harbor home prices with 6.5 months of homes in the $1,250-000-1,500,000 category and 20 months at $1,500,000 plus. Multiple offers are rare in the upper reaches and sellers likely have a longer wait especially at $1,500,000. Exceptions are found for homes in high demand areas, turn-key and priced where buyers believe it to be current market value. Currently 20 homes are available with just one sold in April and none pending.
So…pleased may be the seller under $750,000 and the buyer over $750,000, and trying perhaps for the buyer under and the seller over that mark.
Tags: Gig Harbor home prices, home prices in Gig Harbor