Feb 05 2010
Gig Harbor home prices down 7%…but still less than county
Gig Harbor home prices down 7%...but still less than county
When the News Tribune reported last month the average price for a home in Pierce County had fallen 12% from 2008, following a drop of 9% a year earlier, I decided to compare average Gig Harbor home prices with the county's average.
Normally the median sales price (half the sales above and half below) is used for comparisons locally, as well as nationally. In January I reported that the median was actually up 1% year-over-year for December but down 4% from two years earlier.
Gig Harbor home prices did take a hit when you assess the entire year-dropping 7%-- and an even larger 11% punch from 2007 to 2008. However, even combined, the figures were still better than Pierce County as a whole. The table below compares Gig Harbor zip codes 98332, 98333 and 98335 for closings in December over the last seven years.
The first three quarters of 2008 held up fairly well but, as could be expected, the fourth quarter was the killer. There was a full $100,000 difference in both average and median Gig Harbor home prices, comparing June 2008 to December 2008. This is the reason why December year-over-year is up but 2009 is still down for the entire year
Key Peninsula was off its 2008 average by 16% and off 23% for the combined 2008-09 years--following closely the county trend.
Sellers need to look realistically at the price range buyers are purchasing today. The graph below clearly illustrates the "disconnect" between what sellers are asking and buyers are buying. Buyers are closing on homes, on average, today $250,000 less than the list price-this is 38% less than the average list price. In 2002 the spread was only 25%. Obviously, this does not mean a specific house sold for 38% less than its list price...simply there is a huge spread between Gig Harbor home prices-listing and selling.
These lower average prices are being fueled in part by the "resetting" of real estate values as well as by the huge percentage of first time buyers in today's marketplace, utilizing the tax credit. One possible scenario when the tax credit expires in April is that the number of sales will fall off but the market will neutralize, with less concentration of first-time buyers. Because this particular market segment will drastically be reduced, it could result in an elevation of sales prices-even with fewer buyers.
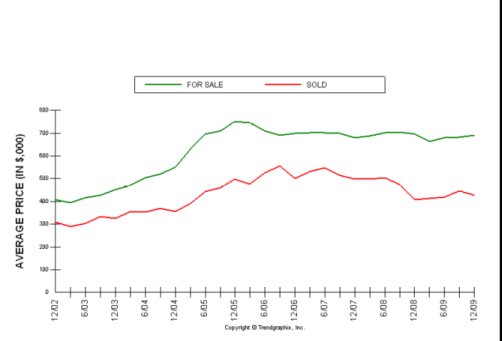 Gig Harbor Average Sales Price
Carole Holmaas is a licensed Associate Broker, licensed since 1967, at Windermere Real Estate/Gig Harbor. She may be reached at 253.549.6611 or Carole@ISellGigHarbor.com. Her blog may be followed at http://Blog.ISellGigHarbor.com
Gig Harbor Average Sales Price
Carole Holmaas is a licensed Associate Broker, licensed since 1967, at Windermere Real Estate/Gig Harbor. She may be reached at 253.549.6611 or Carole@ISellGigHarbor.com. Her blog may be followed at http://Blog.ISellGigHarbor.com
| Current | 1 yr | Current | 3 yrs | Current | 7 yrs | |||
| Dec 09 | Dec 08 | Dec 09 | Dec 06 | Dec 09 | Dec 02 | |||
| Average Sold Price | $426k | $409k | $426k | $501k | $426k | $310k | ||
| % Change | 4% ▲ | 15% ▼ | 37% ▲ |
Gig Harbor Average Sales Price
Carole Holmaas is a licensed Associate Broker, licensed since 1967, at Windermere Real Estate/Gig Harbor. She may be reached at 253.549.6611 or Carole@ISellGigHarbor.com. Her blog may be followed at http://Blog.ISellGigHarbor.com Comments Off on Gig Harbor home prices down 7%…but still less than county
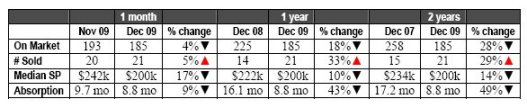 Realtors have been pleased with the relatively strong market for December and the momentum appears to be continuing with sales activity in January. Much of those sales are being driven by the first-time home buyer tax credits and low interest rates. Interest rates are starting to tick upward and are expected to peak around 6.5% during 2010.
Inventory continues to drop-down 33% from last year at this time. This is helping stabilize prices as the home supply dwindles. Key Peninsula is currently experiencing just an 8.8 month supply of homes on the market. For the homebuyer, that means if no new homes were listed, it would take about nine months to sell the current inventory. I would expect the supply to drop even more as January sales activity continues to hum.
Carole Holmaas is an Associate Broker at Windermere Real Estate/Gig Harbor, licensed since 1967. She may be reached at 253.549.66 or Carole@ISellGigHarbor.com. Her blog may be followed at http://blog.ISellGigHarbor.com
Realtors have been pleased with the relatively strong market for December and the momentum appears to be continuing with sales activity in January. Much of those sales are being driven by the first-time home buyer tax credits and low interest rates. Interest rates are starting to tick upward and are expected to peak around 6.5% during 2010.
Inventory continues to drop-down 33% from last year at this time. This is helping stabilize prices as the home supply dwindles. Key Peninsula is currently experiencing just an 8.8 month supply of homes on the market. For the homebuyer, that means if no new homes were listed, it would take about nine months to sell the current inventory. I would expect the supply to drop even more as January sales activity continues to hum.
Carole Holmaas is an Associate Broker at Windermere Real Estate/Gig Harbor, licensed since 1967. She may be reached at 253.549.66 or Carole@ISellGigHarbor.com. Her blog may be followed at http://blog.ISellGigHarbor.com