Archive for the 'Gig Harbor Waterfront' Category

Feb 22 2017

Gig Harbor waterfront prices increase 18% but high-tier not catching up

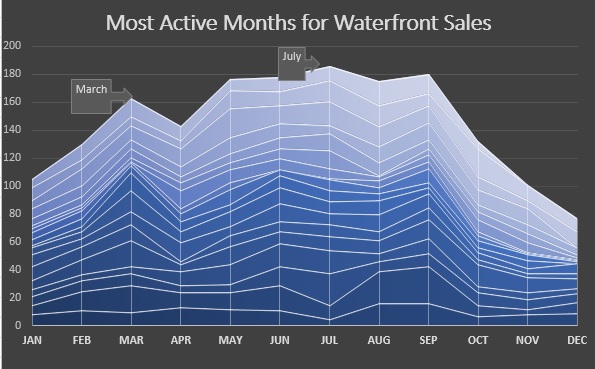
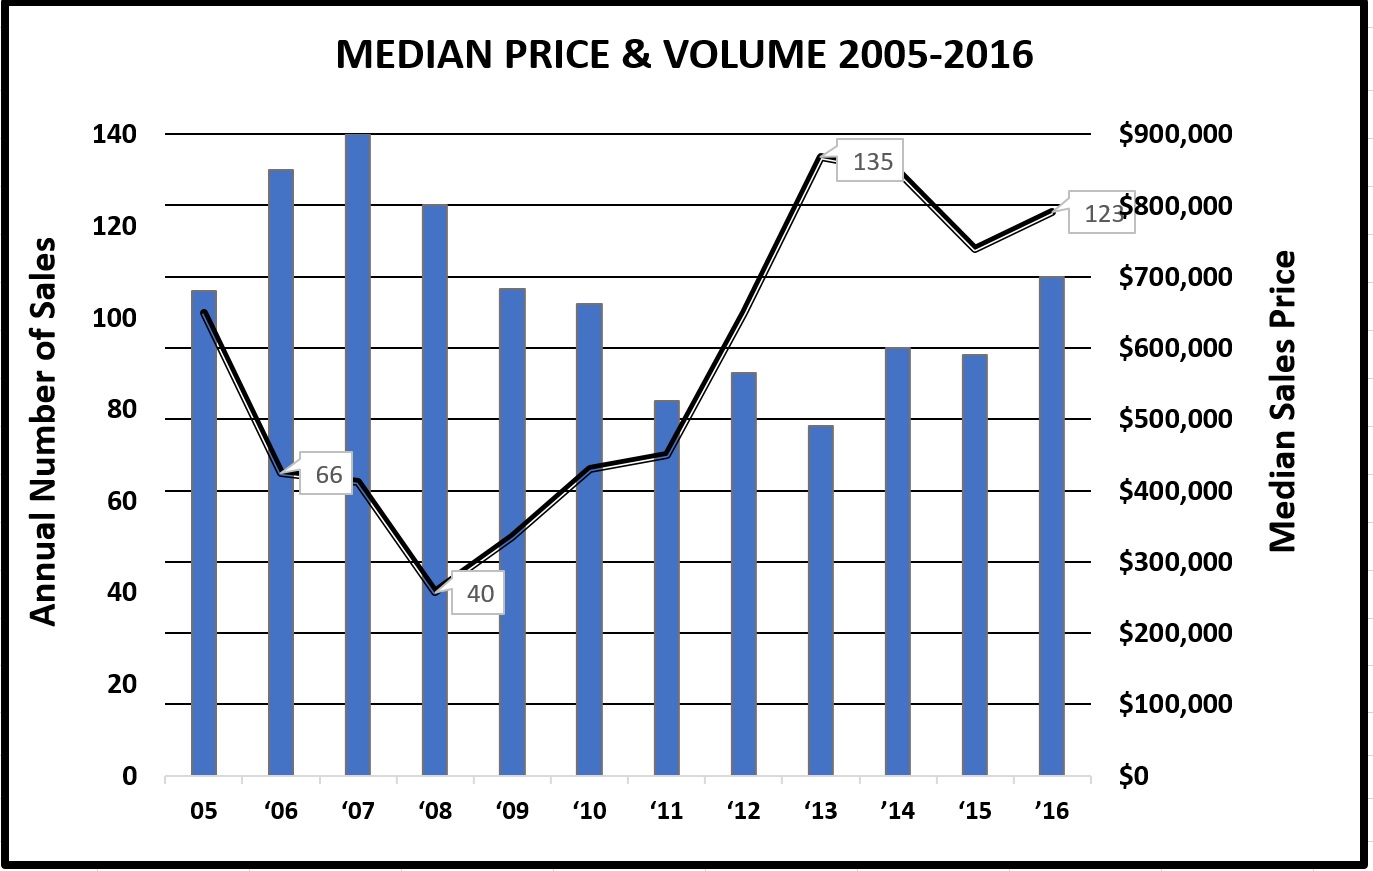
Gig Harbor waterfront prices increase 18% but high-tier not catching up. 2016’s sales neared 2013-14’s record for volume. But the real news is the 18.65% bump in median price for Gig Harbor waterfront homes–the point where half of all sales were more and half less than $700,000.

Sale prices of all Gig Harbor homes have recovered to best the peak years but the very high-tier waterfront prices have not caught up. Today prices are 22% off the 2007 $900,000 peak. 2017 could however minimize that difference for Gig Harbor waterfront.

In 2006-08, 35% of Gig Harbor waterfront sales were over $1M. In 2016, only 21% were over $1M. In 2006, 23 homes sold over $1M. In 2016, 26 homes sold–nearly the same, but twice the overall volume.

The selling price for the 10 homes that sold for $1.5M or more averaged 163% of their assessed value last year, something buyers need to be cognizant of in offering…and 133% in the $800-1M price range. Looking ahead at the 2017 assessed values, I believe prices for Gig Harbor waterfront will continue to outpace county assessments West to Southeast exposure was the norm for the $1.5M price range, and they averaged 154 feet of frontage. One third had docks and nearly all were low to medium-low bank…normal for the high-tier.

Some final thoughts–

  • I believe there is a “backlog” of a minimum of 150 Gig Harbor waterfront owners who are ready to move–if market conditions (read prices) permit. This year should bring more of these properties to market.
  • New flood plain maps will be implemented March 7, affecting Gig Harbor waterfront low bank. Sellers and buyers should review FEMA’s website for maps to see the impact for flood insurance rates in high-velocity wind and reach situations.
  • Additionally, the long-waited Shoreline Master Plan revision is scheduled for adoption this year, expanding shoreline setbacks and restrictions. I was on the committee when it began in 2008…now eight years later. So…lots going on.

No responses yet

Feb 28 2016

Gig Harbor waterfront best sales months are here—sellers should be on the market now!

Gig Harbor waterfront best sales months are here—sellers should be on the market now! My graph is a big part of this week’s blog. By choice, buyers of low and medium-low bank Gig Harbor waterfront buy in early spring for the ability to enjoy it starting in May or June. We are approaching March—traditionally one of the most active months for sales. Relocation, purchases of “tear-down homes” for rebuilding, and purchases where the primary interest is view, rather than accessibility, provide additional sales throughout the year. Sales made in March for Gig Harbor waterfront will likely close in April or May—45-60 days out.

BEST SALES MONTHS: March has been the #1 selling month in 4 of the last 18 years for Gig Harbor waterfront . March has actually ranked either #1, #2, or #3 40% of that period. Last year March was #2 in new sales. Aggregated over the years, the best months are July, September, May, June and August in that order. Those sales typically close 45 days later. But those months’ sales include more second home usage, Key Peninsula and generally under $1m price tag.


2015 Waterfront roundup

MEDIAN SALES PRICE:  2006-08 were boom years for Gig Harbor waterfront  prices—$800-900,000 was the median. But the year just prior to the boom—2005—the median price was where it has been the past 2 years–$600,000.

TOP TIER: The over $1M category produced 1 of every 4 sales in 2015. At the market height 35% of sales were over $1M. That plummeted to 10%—then jumped to 24% last year. 2 of every 3 sales in the top tier were initiated before June, with half by March. Gig Harbor waterfront buyers want to be using the waterfront—either on land or by boat–in the summertime.

INVENTORY: With Gig Harbor waterfront  inventory even tighter this year, new listings, if priced right, disappear as fast as they are listed.  That should keep prices rising in 2016.   The median price of the 37 homes listed in Gig Harbor/Fox Island is $1,100,000 & in Key Peninsula $745,000 for 8 homes. That 45-house total is down from the past couple years. If, on the other hand, many of the 175 waterfront “pent-up sellers” enter the market, it could hold down prices. 175 is my take of the number of Gig Harbor waterfront sellers who would sell and move—if market conditions & prices permit.

I believe the earliest sellers of Gig Harbor waterfront  to the marketplace this year will get the benefit of low inventory, coupled with historic low interest.


No responses yet

Jan 26 2015

Gig Harbor waterfront posts healthy price uptick

 Gig Harbor waterfront posts healthy price uptick

Gig Harbor waterfront 2014’s sales nearly equaled 2013’s record-breaking year. But the real news is the 18% increase in median sales price for Gig Harbor waterfront. Half of all sales were more than $600,000 and half less. Gig Harbor waterfront sales prices peaked at $900,000 in 2007–now at 2005 levels.


But the sales pattern for Gig Harbor waterfront was atypical—the market slowing precipitously 4th quarter 2013, continuing through the entire 1st half of 2014. By July Gig Harbor waterfront sales were markedly down–both price & number.


Not surprisingly, all 23 $1m plus sales occurred in Gig Harbor & Fox Island. But what was noticeable was the buying intensity 4th quarter in the upper end. Only 6 Gig Harbor waterfront  offers were accepted in the entire 1st half, 7 in the 3rd quarter & 9 in the 4th, mirroring consumer confidence. 10 of those 23 sales closed in November & December alone. $655,000 was the high sales price for Key Peninsula.


What a difference a year made in the over $1m tier for Gig Harbor waterfront. 2013’s record sales volume produced the smallest percentage (10%) of sales over $1m & the lowest median sales price ($490,000) since 2004. But 2014’s nearly equal numbers showed a healthy uptick of 17% high-end sales with 18% increase ($600,000) in median sales price.


Median Sales Price 2006-2014
Year Sales Price % Change # $1.5m+ # $1m+ # All Sales %  $1m+
‘06 850,000 13 10 66 35%
‘07 900,000 ↑6 6 17 64 36%
‘08 800,000 ↓11 3 11 40 35%
‘09 682,500 ↓15 3 6 52 17%
‘10 662,000 ↓3 2 15 67 25%
‘11 525,000 ↓20 2 7 70 13%
‘12 565,000 ↑8 4 10 101 14%
‘13 490,000 ↓13 5 9 135 10%
’14 600,000 ↑18 6 17 132 17%


The current slim inventory of Gig Harbor waterfront—coupled with historically low interest rates & easier financing should keep prices rising in 2015.  Median list price of the 38 homes in Gig Harbor/Fox Island is a shy $1m & in Key Peninsula $435,000 for the 18 homes listed. On the other hand, if an abundance of “pent-up sellers” list, it could hold down prices. I calculate a minimum of 250 Gig Harbor waterfront owners are ready to move—if market conditions (prices) permit.


Gig Harbor waterfront homes $1m plus sold on average for 150% of assessed value in 2014. Average frontage was 102 feet, considerably down from 170 feet the year before. Only 5 had more than 125 feet. 50% had docks or dock permits & 85% were low to medium-low…nothing unusual here. Homes $750,000-1,000,000 sold on average for 120% of assessed value.


Distressed Gig Harbor waterfront  home sales are becoming nearly a non-issue—just 2% of the sales last year were short-sales and 5% were bank-owned, down 9% & 13% 3 years ago.


Carole is a Broker at Windermere/Gig Harbor, specializing in Gig Harbor waterfront and view properties. She may be reached at 253.549.6611 or Carole@ISellGigHarbor.com

No responses yet

Dec 21 2014

Gig Harbor home sales continue nicely in “recovery mode”

Gig Harbor home sales continue nicely in “recovery mode”

In a nutshell—Gig Harbor home sales prices are up, inventory & sales volume are flat, upper tier is appreciating, & new construction is impacting buyers. Here’s my take for the September-November quarter for Gig Harbor & Fox Island, compared to a year ago…

Sales prices ↑ 6.2%

A 6.2% increase in Gig Harbor home sales brings the median sales price (the mid-way point in sales prices) to $378,000 for the quarter. The single month of November was $432,000 — 31% over October and 44% from last November. Prices for Gig Harbor home sales have been gradually strengthening all year after a low of $303,000 in January. This increase should allow more sellers to list – gaining some of the equity lost during the housing bust – and adding to the inventory the market badly needs.

Prices are down 20% from the 2006 third-quarter peak — at summer 2005 prices. Important to note, at the peak, new homes made up a substantial number of sales at $600-750,000, elevating over-all prices. The 6.2% uptick is realistic appreciation I believe, after a stagnant 3 ½ years, ending with second quarter 2014.

Resale non-distressed homes appreciating

These are sales of existing homes – not short sales or bank-owned. Sales prices have steadily been gaining since March, except for October – at $384,000 — down 14% from the 2006 third-quarter peak. The single month of November was $448,000 –the highest single month’s sales price since August 2006 ($475,000) when prices for Gig Harbor home sales turned the corner. However, too much cannot be read into this single month.  22% –11 of the sales were waterfront homes over the median sales price – never before seen in November.

Sales Volume ↑ 1.4%


Pendings ↑15.9%

Contracts written but not yet closed are up with renewed consumer confidence, threat of future higher interest rates and easing of loan requirements.

Inventory “flat”

Inventory is still low, which can lead to multiple offers and homes selling above their list prices. Routine in the Seattle area but it happens here too. Local brokers point to the quality of some homes plus unrealistic pricing in Gig Harbor. They say buyers often will not even look at a house they perceive to be over-market but wait for a price reduction before even viewing it.

New home inventory 26% of the market

With a quarter of all inventory new homes the market is decidedly different for buyers than a year ago when it made up only 16%. With fewer resale homes – and more new homes –some buyers are having to change search parameters – especially when it comes to lot size. The Growth Management Act regulates density where utilities can service it, forcing smaller lots. Half of new homes currently are on smaller square footage than the traditional 12,500 – 35% are on 5000 or less –and half of those on less than 2300. This can provide more buyer interest for resale homes on larger sites.

Short-sales ↓50% – REO’s flat

The distressed market continues to retreat — just 10% of Gig Harbor home sales. It was 13% last year.

Waterfront sales on par with 2013

Sales volume on the two peninsulas looks to nearly equal the 135 sales last year. But the real story here is increasing prices – we could see a median sales price uptick of $100,000 when all the dust settles—bringing it to the $600,000 range.  And even bigger news is the $1m plus tier for Gig Harbor home sales . 2014 will end with the same number of sales over $1m as in 2006 and 2007—21. Over 90% of the $1m sales came in the last half of the year – again low interest, good values, and increased consumer confidence. (See Resale Non-Distressed Sales above)


No responses yet

Sep 01 2014

Gig Harbor waterfront prices up 10%

Gig Harbor waterfront prices up 10%

Gig Harbor waterfront prices up 10%, January to mid-May, over the 2013 year. The entire price bump is coming from Gig Harbor and Fox Island—up 14% while Key Peninsula is experiencing a 7% decrease. Here are the highlights…

Sales volume for Gig harbor waterfront

  • On track for 100 sales by year-end—fairly typical
  • Slower thus far than 2013’s all-time high of 135
  • Sweet spot is $500-600,000, 4 closed/2 active listings
  • Also $400-500,000, 8 closed/14 listings
  • Also $900,000, 4 closed/8 listings

Median sales prices y-t-d for Gig Harbor waterfront

  • Prices ↑ 10% on both peninsulas over 2013 year–$550,000
  • Prices still ↓ 38% from 2007 peak
  • $1m+ represents 30% of listings—but just 11% of sales
  • $1m+ average 2 years on market before sale
  • Under $1m—average under 6 months on the market
  • Gig Harbor/Fox Island ↑ 14% over 2013–$713,000
  • Gig Harbor highest sale $2,960,000 after 6 ½ years
  • Key Peninsula ↓ 7%–$ 395,000
  • Key Peninsula highest sale $600,000 this year

Proposed Gig Harbor waterfront changes muddy the waters

The proposed all-new Shoreline Master Plan for Gig Harbor waterfront, mandated by the State, is proceeding cautiously—with local  hearings postponed by the Pierce County Council. The Council has chosen to push back against the State Department of Ecology on issues including buffers and aquaculture, but with the threat the State will impose more onerous regulations on shoreline properties if the Council can’t agree. The current 50 foot “setback” is proposed to change to a 75-150 foot “vegetative buffer.” And structural expansion into the “buffer” would be limited to 25% of the existing footprint, in most cases.

Every Gig Harbor waterfront owner should pay close attention to the current process and seek professional assistance, “sooner than later” if there is any thought of expanding, building or selling in the future.

No responses yet

Feb 26 2014

Cumulative House Appreciation 2014-2018


Cumulative House Appreciation 2014-2018.  The Home Price Expectation Survey 2014 1st Quarter was released last week by Pulsenomics. Pulsenomics surveys over one hundred economists, real estate experts and investment & market strategists asking them to project home prices. This includes three graphs for the national scene, projecting the highest this year and slightly lower the following four years.


Slide2


  1. The pre-bubble trend
  2. The 25% most optimistic experts (bulls)
  3. All projections
  4. The 25% most pessimistic experts (bears)

Slide3

And then, some indications historically of where annual appreciation sits:

Slide1

No responses yet

Feb 16 2014

Gig Harbor waterfront 2013’s sales volume up 33%


Gig Harbor waterfront 2013’s sales volume was up 33% year-over-year.  April through October posted nearly identical volume each month—14 or 15 homes closing each month.  And the number of sales every month was the highest for Gig Harbor waterfront it had been for at least a decade.


Gig Harbor waterfront 2013’s strong activity was due to a nearly “perfect storm” of buying conditions…historically low interest rates the first half of the year, a fair amount of inventory available with pent-up seller demand, easier lending requirements, and the buyers’ realization the market had bottomed. However, the very high tier—over $1million– dropped off precipitously with no Gig Harbor waterfront contracts written after the end of August. This followed the nation-wide fall-off of all price ranges in 4th quarter. This very high-end represented just 10% of all sales—the lowest percentage we’ve seen since 2004.


        Median sales price 2006-2013 Gig Harbor Waterfront

Yr  Sales Price    % Chg    $1.5m+   $1m+   Total Sales     % $1m+

‘06       850,000                                13         10           66                 35%

‘07       900,000           ↑6                 6          17            64                 36%

‘08       800,000           ↓11               3          11             52                 17%

‘10       662,000           ↓3                 2          15            67                 25%

‘11       525,000           ↓20               2            7            70                 13%

‘12       565,000           ↑8                 4          10           101                14%

‘13       490,000          ↓13               5            9           135                10%


  • Gig Harbor waterfront sales prices reached their peak in 2007. Prices have dropped 46% since then–now residing where they were in 2003-2004.
  • The current slim inventory of Gig Harbor waterfront—coupled with still relatively low interest rates and easier financing could mean improving prices for sellers in 2014. On the other hand, if pent-up sellers place a surge of homes in the marketplace, it could continue to hold down prices. I believe there is a minimum of 250 waterfront owners who are ready to move—if market conditions (prices) will permit.
  • Gig Harbor waterfront homes selling above $1m sold on average for 150% of their assessed value in 2013. Average waterfront was 170 feet.  Nearly all faced West or Northwest, 3 had docks, and 8 were low or no-bank…nothing unusual here.
  • Homes selling from $750,000-1,000,000 were on average 120% of their assessed value. Sites here averaged 136 feet, slightly more than half faced north or east, most the rest south.
  • Gig Harbor waterfront distressed home sales were down—just 9% of the sales last year were short-sales and 4% were bank-owned. This is a great reduction from two years ago at 9% and 13% respectively. The most expensive bank-owned house sold for $875,000 on Fox Island.
  • There may be a window of opportunity for Gig Harbor waterfront  sellers now in early spring to take advantage of low inventory and buyers before more sellers enter the marketplace.

No responses yet

Mar 19 2012

Higher prices for Gig Harbor waterfront as 2012 emerges

Higher prices for Gig Harbor waterfront as 2012 emerges

A little good news for Gig Harbor waterfront sellers at the beginning of 2012—median prices are up 10% over 2011’s dismal showing.  Plus sales are definitely up—the first year since 2003 we have closed 13 homes in the first two months.


2011’s 4th quarter strong activity was due to a “perfect storm” of buying conditions…historically low interest rates, a perception the market was bottoming, and “pent-up demand” by sellers to sell.

Homeowners ask me how market conditions have affected the value of their Gig Harbor waterfront home. During the downturn I have tried to provide perspective to this each year. Here are 2011’s statistics, with my comments.

While 2007 was the year the median sales price for Gig Harbor waterfront reached its peak, it was also the year the market started to decline. Prices have dropped 43% overall from 2007 to 2011 and now reside where they were in 2004. Factoring in the first two months of 2012 sales, the Gig Harbor waterfront median price is now down 36% from the pinnacle. The Gig Harbor peninsula actually experienced a slight uptick in prices in 2011 while Key Peninsula dropped.


Distressed homes

13% of the sales last year were bank-owned homes and 9% short-sales. This was higher than 2010 with only 17% in these two categories. In most cases short sale homes sold just below the county assessed value. But bank-owned waterfront homes sold for 25-45% less than assessed value.

Current inventory is low…low

17% fewer Gig Harbor waterfront homes are on the market compared to a year ago. This slim inventory—coupled with fewer foreclosed waterfront homes, still low interest rates and gradually loosing financing should bring a strong spring selling season and improving prices for sellers in 2012. And March is historically the month more contracts are written than any other.

If you would like more information about Gig Harbor waterfront or have just a question, I would be happy to talk with you. You may email me at Carole@Gig Harbor-Waterfront.com or call me at 253.549.6611.


Carole is a Broker at Windermere/Gig Harbor, specializing in Gig Harbor waterfront and view properties. She may be reached at 253.549.6611 or Carole@GigHarbor-Waterfront.com


No responses yet