Archive for the 'Key Peninsula home prices' Category

Jan 30 2017

Gig Harbor home prices rise nearly 24%. But the devil is in the details!

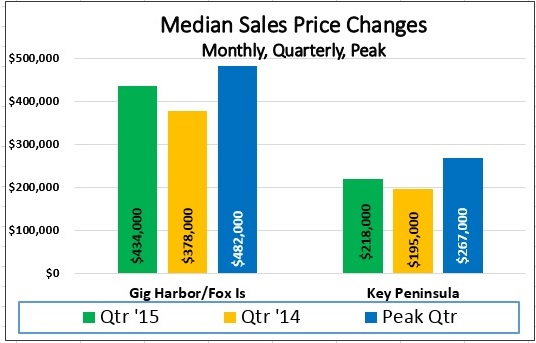
Gig Harbor home prices rise nearly 24%. But the devil is in the details! The median sales price for Gig Harbor and Key Peninsula combined is up nearly 24% year-over-year for 4th quarter. $393,000 tops the $353,000 from a year ago. I used the full quarter of statistics to equalize any single month’s velocity. And I used the end of the year to most represent the current market.  But details for each area vary widely.

New construction dominates close-in Gig Harbor home prices, including the booming area surrounding Costco as well as Rosedale. Fox Island and Wollochet statistics are heavily weighted from waterfront sales.  And a drop in distressed sales had a major impact for some of Key Peninsula home prices.

Gig Harbor–New home sales captured 41% of all sales, pushing the Gig Harbor home prices in this area up nearly 20% to $464,000. Waterfront sales were down by half, dropping median prices to $400,000 from $836,000 in that category.

Gig Harbor North–1 of every 8 sales was a new home, predominantly in Crescent Lake Estates. That market jumped $561-730,000. Gig Harbor home prices in this area showed an uptick $500-535,000 for 7%. While waterfront prices jumped 35%, less than half the number sold.

Fox Island–Prices jumped 45% $419-609,000 overall, with waterfront prices up 30.9% –$943-1,234,000. There are many view homes on the island, which helped push up the sales price. However, a smaller percentage of the sales was waterfront than a year ago. The few new homes on the island also added to the increase.

Gig Harbor home prices

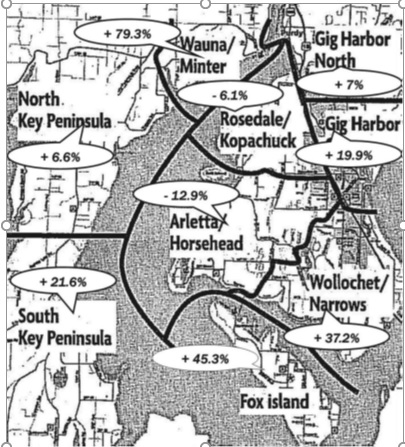
Median Home Prices 4th Q 2016 change from 2015

Arletta/Horsehead–21% of all sales were new homes with the median here for Gig Harbor home prices down slightly. 50% more waterfront homes sold this year, but those sales were down in price $935-835,000. There were more waterfront sales, albeit less pricey.

Wollochet/Narrows– 35% more waterfront homes sold, boosting Gig Harbor home prices here $422-800,000, pulling up the entire market $339-465,000 for a healthy 37.2% increase overall.

Rosedale/Kopachuck–The median price dropped here, $527-495,000. 1/3 fewer waterfront homes sold and those prices were down 30% to $583,000. Overall there were just fewer sales.

Wauna/Minter–Wauna and Minter experienced a huge boom in prices –$222-398,000. Double the waterfront sales and 1/3 fewer distressed sales made all the difference for this area with a 79% increase in median price.

North Key Peninsula–Here a reasonable increase $229-244,000. A 20% drop in distressed sales was a boost.

South Key Peninsula–Here a nice comeback $190-231,000 the past year. A few less waterfronts sold but distressed sales dropped 35%, making a major difference in the median price.

Regionally, prices year-over-year 4th quarter rose 12.9% for Pierce County, 4.3% South Kitsap, and 13.8% for King County.


No responses yet

Dec 05 2015

Gig Harbor home prices look healthy going into 2016

Gig Harbor home prices look healthy going into 2016, as we approach the end of the year.

A good gauge for Gig Harbor home prices (including Fox Island) is the quarterly figure of $434,000 — up a substantial 14.8% from a year ago, positioning Gig Harbor home prices very close to the peak years of 2006-07. The single quarter high was summer 2006.

New construction continues to produce one in four sales for Gig Harbor, while it creates one in three listings – typical for an area desirable to live and not yet built-out.

Key Peninsula’s improvement is more difficult to quantify. While Gig Harbor homes have gained value consistently all year, the Key has ranged from value increases as low as 2% to as high as 35%. Likely explanations include 1) the number of waterfront homes trading in a single month 2) a smaller number of sales in any single month 3) more distressed sales than Gig Harbor and 4) lack of new construction.

Nov blog color graph


Top Quartile of Sales Makes Comeback

The top quartile of sales…that is the top 25% of sales by price…is making a noticeable comeback. That quartile encompasses sales starting at $580,000 currently and everything above—a strong increase from the $500,000 a year ago.

And while sales over $1m will always be a relatively small number, the 36 sales this year to date are nearly double 2014 and represent the highest number since 2007. The $1m+ category for Gig Harbor home prices has languished at less than half that number for the past six years. In 2014 this category included only view or waterfront homes. 2015 sales include a horse farm, Canterwood homes, and waterfront land as well. Market days have dropped from 127 to 102. All of these sales occurred in the Gig Harbor/Fox Island area.

The stage should be set for a continuing robust market for the top quartile in 2016.


No responses yet

Sep 18 2015

Gig Harbor August home prices up 13.8% over 2014–8% off 2006 quarterly peak

Gig Harbor August home prices up 13.8% over 2014–8% off 2006 quarterly peak. Both Gig Harbor and Key Peninsula markets are looking very healthy, as we approach the 4th quarter.

The year started a bit slow with the prices trending $75,000 lower in Gig Harbor.  But August’s median sales price of $470,000 is the single highest month since May 2007—and is reminiscent of roaring 2006. A better gauge though, in my opinion, is the quarterly figure of $442,000 which is up a solid 8.6% from a year ago and positions Gig Harbor to prices just 8% off that peak.

Key Peninsula’s improvement is more difficult to gauge. While Gig Harbor has been gaining consistently all year, the Key has fluctuated as much as 2-35% in a single month. This can be explained by many waterfront homes trade heavily in the spring and summer months, which can bounce prices around. The Key is still feeling the effect of more distressed sales than Gig Harbor (20% compared to 6%) as well as not receiving the number of new home sales. But overall the Key is looking healthy, with only a 3.9 month supply of homes for sale.

Noteworthy…

  • Gig Harbor MSP August–↑13.8%
  • Key Peninsula MSP August↑33%
  • Pierce Co MSP August ↑6% — $250k
  • King Co MSP August ↑13.2% — $451k
  • Kitsap Co MSP August ↑8% –-$260k
  • Inventory is building very slowly but new listings are barely staying ahead of pending sales
  • New home sales continue increase—20% of sales in Gig Harbor–26% of listings
  • Gig Harbor’s volume was third highest recorded, on the heels of 4 months of record setting numbers


No responses yet

Jan 26 2014

Gig Harbor home sales annual review—strictly resale

Jan graph

Gig Harbor home sales


Gig Harbor home sales annual review—strictly resale. This may surprise you but 2nd quarter 2013 and 3rd quarter 2012 realized median sales prices near the 2006 peak of $425,000. This is “strictly resale” homes—not bank-owned nor short-sales.

Today’s graph of Gig Harbor home sales shows resale, new and bank-owned sales plus the resale trendline, by quarter, from $400,000 in 2005 to $370,000 today.  Resale is now off just 13% from its peak and only 7.5% from its trendline. Sale prices performed well in the first half 2013…but removed much of those gains in the second half…performing at 2005 prices.This is true of all Gig Harbor home sales.

More stats on the resale market

  • Current $370,000 sales price is considered neutral, based on a 6-quarter trend
  • Sold-to-listing price ratio  is up to 94% from 89% a year ago
  • With 40-55% of 2006-07 sales new large homes, this pulled up the sales price overall above $450,000 —  just as bank-owned sales pulled it down below $325,000

I offer some observations…positive and negative for Gig Harbor home sales

  • The recent Boeing contract and high tech industry will produce a more robust housing market than much of the rest of the nation
  • Interest rates will likely  climb to 5.4% by year’s end and lending will be less supportive to a housing recovery
  • Income growth will continue very slowly. This is the deepest and longest employment “recovery” we have experienced since the Depression
  • Investors have pulled back from buying homes, creating part of the slowdown in sales since summer
  • Inventory will stay low until sellers can retrieve more of their equity—higher sales prices. Nationally 13% of homeowners owe more than their home is worth. Washington is 11th for foreclosure filings, bucking the national trend
  • Puget Sound sales volume has dropped the last 3 months after all 2013’s earlier months topped the charts
  • January 10’s tighter underwriting standards will keep more first-time buyers renting


No responses yet

Jan 26 2014

Gig Harbor resale home prices down just 5.1% over peak

Gig Harbor resale home prices down just 5.1% over peak. Stripping out new home and distressed home sales, Gig Harbor resale prices are actually down just 5.1% from the 2006 peak. Hopefully this week’s graph will provide some perspective for sellers as they contemplate marketing their home in 2014. The numbers show Gig Harbor resale prices down 21% from its boom but that figure includes distressed sales and new home prices that outpaced the rest of the market by $150,000-300,000 at the peak.  New homes were much larger than the product being built today in Gig Harbor North. All sales combined are up 6.3% over a year ago.

A caveat – Competition for any home sale depends on the options available to the buyer at that time. It is one thing to compete in a market with a 2-year supply of homes and 50% of it distressed compared to a 4-month supply of homes with only 10% distressed currently.

While first quarter 2013 was the low point for combined Gig Harbor sales prices, this entire year has been the highest (with an exception in early 2010) since first half 2008 for Gig Harbor resale prices itself.

Inventory is down 47% from first half 2008 high. Gig Harbor hasn’t experienced low inventory since 2004-05. This is why brokers routinely urge sellers to consider marketing early in the year – traditionally a low inventory period, producing faster sales and higher prices.

Dec graph

Gig Harbor resale prices

No responses yet

Apr 01 2013

Existing Gig Harbor home prices take jump


Existing Gig Harbor home prices take jump. My past reports of year-over-year drops for Gig Harbor home prices may be behind us for now. Existing Gig Harbor home prices are up over 11% for the November-January quarter, over a year ago, for Gig Harbor/Key Peninsula combined. And one home sale just closed for $3,600,000—the first sale over $3 million for nearly five years.

Existing Gig Harbor home prices— median

  • Gig Harbor ↑ 5.3% quarterly
  • Key Peninsula  ↑ 3.9% quarterly
  • Pierce County ↑8.4% quarterly
  • Gig Harbor/Key Peninsula  volume ↑ 19% quarterly (12.5% annually)
  • Inventory ↓17% from a year ago


New Gig Harbor home prices–median

  • Gig Harbor/Key Peninsula  ↓ 42% quarterly
  • Gig Harbor/Key Peninsula ↓ 22.5% from 2010
  • Gig Harbor/Key Peninsula volume ↑ 250% quarterly (40% annually)

An interesting sidebar to our trending Gig Harbor home prices is new construction.  Nearly all of Gig Harbor’s current construction is in Gig Harbor North…Quadrant and Rush. New construction accounts currently for less than 10% of all sales, with the median price hovering under $300,000. In 2010 the median price was $470,000 and in 2011 $330,000. This year’s median price computes to a 13% drop in price from 2011…and 39% for the year before.

Gig Harbor’s new construction pricing will be a drag on the combined new and existing median price, at least for a while. For a better perspective of the trending market for Gig Harbor home prices going forward I will separate these two.  Sellers have more interest in resale prices while buyers watch both new and existing prices as they make their buying decisions.

Two of the county’s other major new home areas have experienced an increase in sales price, compared to Gig Harbor home prices; at the same time new construction is a larger portion of their overall sales. In Puyallup roughly 25% of sales are new homes with prices up 4.7% quarterly from a year ago.  New homes in Bonney Lake account for about 16% of sales and prices have increased 8.8% for the same period.

The price differences can be explained, in part, that during the economic downturn builders in the east side of the county were able to take advantage earlier of bank foreclosed plats, with drastically reduced lot prices. Builders passed lower lot costs on to their consumers. Banks took longer to foreclose on builders/developers in Gig Harbor and the current inventory is now reflecting those lower lot prices and thereby Gig Harbor home prices. Six years ago Gig Harbor had a bevy of small builders building high-quality product on larger lots. Currently most of those builders are gone and only the corporate builders remain, building on smaller Urban Growth Area (UGA) size lots.

This may change slightly as two builders have purchased lots in two uncompleted subdivisions and will likely be building in the $450-550,000 range.

No responses yet

Mar 30 2013

Gig Harbor home prices end 2012 on a high note!


Gig Harbor home prices end 2012 on a high note! The statistics say it all…Gig Harbor home prices are making a “comeback.” Let’s check off the changes in the median sales price (half the sales above and half below this price). Nearly all signs are UP.

GIG HARBOR/FOX ISLAND PRICES

  • ↑ 3.7% 4th Qtr 2012/2011
  • ↑ 5.3% Dec  Y-O-Y
  • ↑ 2.9% Dec over Nov
  • ↓ 20% 4th Qtr 2012/2006

KEY PENINSULA PRICES

  •   ↑ 10% 4th Qtr 2012/2011
  •   ↑ 19% Dec Y-O-Y
  •   ↑ 32% Dec over Nov
  •   ↓ 13% 4th Qtr 2012/2006


Gig Harbor home prices are 3.7% higher for the 4th quarter over the prior year and Key Peninsula sales prices have improved 10% in the same year-over-year period.

Gig Harbor and Key Peninsula sales prices in 2011 decreased three out of every four months from 2010. While the same was true for Gig Harbor home prices most of the first half of 2012 the market recovered faster and stronger for Key Peninsula. But by summer Gig Harbor home prices stabilized as well.

Gig Harbor is now down only 20% for 4th quarter from the housing boom period in 2006 for a median price of $340,000.  Key Peninsula is down 13% for a sales price of $218,000.

Sales numbers have come roaring back too, with each of the last five months marking the most sales since 2005 in Gig Harbor.

In Gig Harbor home prices are currently down 20% from late 2006 and 12% from two years ago. This emphasizes just how much of a hit the last two years have been… until the past few months.

Inventory is down 15% in Gig Harbor and down 9% in Key Peninsula.  And pending contracts (accepted but not yet closed) are at some of the highest levels since the housing boom…up 83% in Gig Harbor and 120% in Key Peninsula. Brokers were busy right through the holidays as buyers who had been house hunting were eager to have a house under contract by year’s end.

Currently the local market is experiencing a “balanced market” overall. But the strong demand and low inventory does not bode well for buyers this spring. Buyers need to be ready to act when they find the right house and realize in many prices ranges it has become a seller’s market for Gig Harbor home prices. But for sellers who have wanted to sell and “move on” they should have the confidence it is possible if the house is priced right.

No responses yet

Sep 10 2012

Gig Harbor home sales—something for everyone

Gig Harbor home sales—something for everyone

  • Local inventory ↓ 17% from 2011 –7.2 mo supply
  • King/Sno/Pierce inventory    ↓ 42.65% from 2011
  • Median price ↓ 1% Y-T-D –rate of decline slides
  • Waterfront prices↑ 6% Y-T-D
  • Nationally, price increase ↑3.5% not to 2016
  • Local sellers’ market through $350,000 prices
  • Local balanced market through $700,000 prices
  • Washington REO inventory less than 2%

Gig Harbor home sales are trending with overall national figures. Sales–the first part of any housing recovery have come back with vigor. Prices–the second piece of the recovery is lagging. Both Gig Harbor and Key Peninsula have experienced as many positive as negative months this year–again typical nationally.

Prices are declining at a shallower rate than in past months. Both peninsulas are currently at second half 2004 prices for Gig Harbor home sales —improved  from 2003 prices  we experienced most of last year but still down 1% for the first half of the year.

The good news is that distressed Gig Harbor home sales have dropped 10% from the beginning of the year—another national trend. Short sales outnumber REO properties nearly 2-1. And currently distressed homes make up just 10% of the inventory.

Washington is fortunate to have a non-judicial foreclosure process which has cleared the backlog faster than in states where the courts make the determination. This leaves less shadow inventory in the wings as well. In fact Washington has less than a 2% foreclosure rate—one of the lowest in the country. Lenders are working more aggressively with homeowners on modifications and short sales.

An increase in Gig Harbor home prices depends on supply and demand. The supply side is down to seven-month inventory but prices haven’t spiked yet—largely because anticipation of surfacing foreclosed properties. We will know shortly if we need to factor in more than the current 2% into the market pricing equation for Gig Harbor home sales. Inventory in the tri-counties has dropped 42% from last year—the fifth largest drop in the nation.

So this summer is an excellent window for sellers—inventory is low and interest rates have never been lower. Home supply is down nearly 20% from a year ago and over 40% from the peak. It is truly a sellers’ market under $350,000 and a nicely balanced market up to $700,000.

There is a tremendous pent-up demand for sellers who want to move for employment, be closer to family or scale down in size. And there appears to be little reason to wait for price increases because the national prediction is it will take until 2016 for house prices to reclaim the 3.5% increase in value considered the pre-bubble “normal”.  Maybe a bit more down this year, up 1.3% in 2013 and 2.6% in 2014, is what the June Home Price Expectation Survey says.

Friday respected magazine The Economist, reported “America’s houses are now among the world’s most undervalued: 19% below fair value, according to our house-price index.” Another good reason to buy.

As I said at the beginning…there is something in Gig Harbor home sales news for everyone.


No responses yet

Jul 11 2011

Gig Harbor home prices great for buyers

Gig Harbor home prices great for buyers!

Gig Harbor home prices are great for today’s buyers but discouraging for sellers. Prices are the same as in late 2003.  Key Peninsula home prices are at equal to second quarter 2003.

The usual culprit dragging sales numbers down is the distressed market. When 29% of all sales in Gig Harbor and 56% of Key Peninsula sales are bank-owned or short sales it pulls the numbers down even though the same non distressed home will sell for more.

The graphs tell the story. In 2010 Gig Harbor home prices had a seven month run of improved prices over the year before, but prices plummeted in October, stayed down throughout the winter, bounced up in April and May but declined severely in June. Gig Harbor home prices are now at their lowest point in the last seven and one half years.

Gig Harbor home prices are down 10.5% for the second quarter from 2010 and down 23.4% from May. The10.5% decline speaks to how bad the market still in because the overall drop from the all-time high in 2006—five years ago–is 25%. Supply of homes, based on sales, has been holding in the 10 month range.

GH Med Sales Price - June 2011

Key Peninsula didn’t fare any better. Responsible for a higher percentage of distressed sales, prices are down 16.4% for the second quarter from 2010 and 15% from May. Between 2006 and 2008 there was more price consistency in the market with some of the highs occurring in each of the three years. But June’s low is down 54% from the all-time high of January 2007.

All of the distressed home sales in Key Peninsula were bank-owned whereas the balance between bank-owned and short sales in Gig Harbor is more equal.

KP Median Sales price-June 2011


Closings in July will reflect the first month where a true comparison can be made between current and previous year sales. June 2010 was the last month to close on the loan for first-time buyer credit so last year’s sales were slightly higher in Gig Harbor but the same in Key Peninsula. I would expect the next few months will see sales easily surpassing 2010.

Second quarter news was consistently dismal—oil and food price increases, European defaults, weather, employment, and D.C.’s stalemate over the debt ceiling and deficit reduction. The economy couldn’t get any positive traction and lack of consumer confidence meant buyers were unwilling to buy unless they got a great deal. This is really a “buyer’s market.”

One glimmer of sunshine is that Seattle has seen some strong activity, some multiple offers in certain price ranges, and some price stabilization. As goes Seattle…so goes Gig Harbor, eventually.


Carole Holmaas is a Broker at Windermere Real Estate, licensed since 1967. She may be reached at 253.549.6611 or by Carole@ISellGigHarbor.com/

No responses yet

Apr 08 2011

February brings recovery to Gig Harbor home sales

February brings recovery to Gig Harbor home sales

The short February month brought signs of recovery to Gig Harbor home sales as well as Key Peninsula. While the indicators showed improvement it is too early to tell if a trend is developing. The world economy and political turmoil, as well as unemployment and foreclosures still provide a rocky picture for all of this year.


  Feb 2011 Feb 2010 Change
Gig Harbor home sales

35

26

▲34.6%
Median sales price

$325,000

$312,000

▲4.2%
Gig Harbor pendings

60

46

▲23%


Key Peninsula home sales

18

9

▲100%
Median sales price

$247,000

$207,000

▲19.3%
Key Peninsula pendings

25

25

NC

GH/KP homes on market

610

773

▼21.1%
GH/KP price reductions

157

167

▼5%

Gig Harbor home sales numbers along with Key Peninsula and their accompanying median prices were all up, from January as well. This is a particularly good sign for Key Peninsula which has experienced a very stagnant market for over a year.

The last 12 months has seen a 12% drop in prices in Key Peninsula from the previous 12 months while Gig Harbor’s pricing is essentially flat.

The numerous foreclosures and economic instability is perpetuating another trend—price reductions. One in four sellers dropped their price last month—and this has been consistent the past couple years—while they try to find the sweet spot that will entice the buyer to offer.

 One positive trend we have been seeing for a year now—and one that historically produces upward pressure on prices—is fewer sellers in the marketplace. Unfortunately the reason appears to be sellers holding out, when they can, for the market to rid itself of foreclosures.  Inventory is down 21% currently. There is a nine month supply of homes in Key Peninsula and a 14 month inventory in Gig Harbor.

 Carole Holmaas is a Broker at Windermere Real Estate, licensed since 1968. She specializes in waterfront and view properties. She may be reached at 253.549.6611 or at Carole@ISellGigHarbor.com, where you may follow her blog postings.

No responses yet

Next »