Feb 13 2012

Brakes applied to Gig Harbor home price slide

Brakes applied to Gig Harbor home price slide.

The slide of the last five and a half years for Gig Harbor home prices has slowed in the last couple months while dropping 10% for the year.  Sales for 2011 shows Gig Harbor home prices(including Fox Island) neither bank-owned or short sales in the 4th quarter declined only 3% rather than the 17% drop experienced in third quarter.

  • Inventory is currently down 20% from a year ago and 40% from 2008
  • Median sales price in 4th quarter stood at $352.000 for non-distressed properties and $225,000 for bank-owned or REO (real estate owned).  The REO figure reflects a 19% drop from 4th quarter 2010 Gig Harbor home prices
  • REO sale prices dropped about 15% for the year and non-distressed were down 10%
  • All Gig Harbor home prices are trending  back to 4th quarter 2004 but when removing  distressed sales from the equation prices are similar to 1st quarter 2005 prices
  • Homes are staying on the market fewer days—from 7-8 months in early 2011 to 4 months currently
  • A few more homes and condos sold in 2011 than 2010
  • January Gig Harbor home prices are trending up as well—higher than 6 of the past 12 months

Local 2011 quarterly statistics for Gig Harbor home prices highlight the difference between heavily discounted  bank-owned houses and the “rest of the market”.  REO sales represented 28% of all home sales in the first quarter but only 18-19% the last half of the year. This is expected to increase again as the lenders begin to ratchet up foreclosures after last week’s settlement with the five largest lenders, pertaining to sloppy methodology including robo-signing of documents. REO sales are still expected to maintain a solid presence in the housing market the balance of this year. Nation-wide foreclosures decreased 34% last year over 2010…but are expected to increase 25% in 2012. 

Gig Harbor Median Prices by Quarter


Short sales are not separated out in the table above because they actually do not affect the overall median price much. They are spread throughout all prices and tend to settle closer to the non-distressed market price. In fact the fourth quarter saw short sales close higher than non-distressed sales and much higher than the year before. 2011 is the year lenders have become receptive to the process, along with the help of negotiators who specialize in short sales.

The monthly national data shows some stabilization or increases in select markets one month while the next month produces data showing nearly all metropolitan areas are still down. Bright spots in the Puget Sound are the hiring Boeing and its contractors are doing plus overall improvement in employment.

Carole Holmaas is a Managing Broker at Windermere Real Estate/Gig Harbor, licensed since 1967. She specializes in waterfront and view properties and may be reached at 253.549.6611 or Carole@ISellGigHarbor.com

No responses yet

Nov 28 2011

Good news is absent for Gig Harbor home prices

Good news is absent for Gig Harbor home prices. October sales figures gave mixed messages to buyers and sellers of both Gig Harbor and Key Peninsula. It hasn’t been this good to be a home buyer in nearly eight years. On the other hand for homeowners who purchased in the last eight years selling now is a rude awakening. First the encouraging indicators for Gig Harbor home sales…

  • Gig Harbor listing inventory is down 13% from 2010–12 month supply
  • Key Peninsula listing inventory is down 14% from a year ago–8 month supply
  • The time from listing to an acceptable contract is down 20% from 2010
  • Key Peninsula nearly doubled the sales as 2010 in October…Gig Harbor equaled 2010
  • 30 year interest rates were below 4% last week…15 year at 3.3%
  • Terrific values are available in bank-owned homes for  buyers
  • It is a seller’s market (albeit the bank’s) in the $200-250,000 range for Gig Harbor home sales

Smaller inventory, combined with historically low rates is the traditional mix for a market rebound. It isn’t housing itself that is dragging prices down but buyers’ hesitancy with lack of jobs, the stalemate in DC, volatile global economic issues and the stock market. Unfortunately these factors are producing some of the following statistics for Gig Harbor home sales.

  • September-October Gig Harbor & Key Peninsula sales prices were equal to 2003 prices
  • Bank-owned sales are still a drag on the Gig Harbor home sales– 25% of all sales in October
  • 33% of sales in Gig Harbor were distressed but only 12% of homes listed for sale are
  • Gig Harbor median prices are down 13.6% for the last 12 months, some of Puget Sound’s worse
  • Key Peninsula sales prices are down 10% for the last 12 months, equal to Pierce County as a whole
  • Gig Harbor home prices are 40% off their 2006 peak

There’s not much good news for Gig Harbor home sales in these facts. I’ve used the last 12 month average compared the 12 months prior. This tends to even out the monthly highs and lows.

Our South Kitsap neighbors haven’t seen the same price slide—down just 2.9% as a comparison. The market there has been gaining strength all year, but they experienced an even higher rate—43%–of sales from the distressed arena with 25% of active listings either bank-owned or short sale. And King and Thurston counties are down just 8% and 5.25% respectively with Thurston having less than a two month inventory.

It was about a year ago that forecasters warned prices would slip another 10% nationally. No one wanted to believe it. But Gig Harbor is now down about 40% from the peak in summer 2006.

The “supply and demand” theory is working well for bank-owned properties. There was one buyer for every two homes listed in October. This demand contributes to the price depression.   Meanwhile a shorter supply of bank-owned properties could bode well for non-distressed sellers and maybe a settling of prices for a short time. This may change as more foreclosed properties are marketed for sale.

To put perspective on the price declines for ALL sales versus those not distressed I have used second quarter figures which showed a year-over-year decline of 14% for all sales in Gig Harbor. Non-distressed homes showed a 12% decline, short sales a 9% drop and bank-owned 18%. It is easy to see when bank-owned sales represent 25% of the market (in April as high as 42%) it will draw down the overall figures. But even those non-distressed homes suffer because of the competition.

Investors have come back to buy and they buy in the more affordable price ranges, adding to the downward push of median prices for Gig Harbor home sales.

Carole is a Broker at Windermere Real Estate in Gig Harbor, licensed since 1967. She may be reached at 253.549.6611 or Carole@ISellGigHarbor.com.

No responses yet

Jul 11 2011

Gig Harbor home prices great for buyers

Gig Harbor home prices great for buyers!

Gig Harbor home prices are great for today’s buyers but discouraging for sellers. Prices are the same as in late 2003.  Key Peninsula home prices are at equal to second quarter 2003.

The usual culprit dragging sales numbers down is the distressed market. When 29% of all sales in Gig Harbor and 56% of Key Peninsula sales are bank-owned or short sales it pulls the numbers down even though the same non distressed home will sell for more.

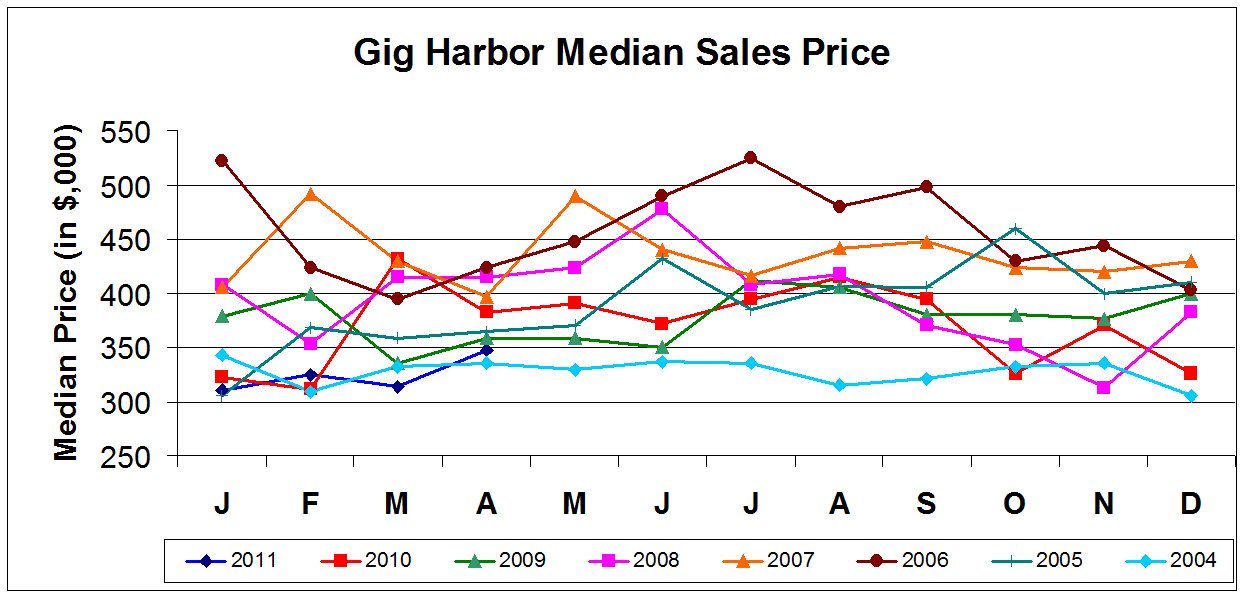
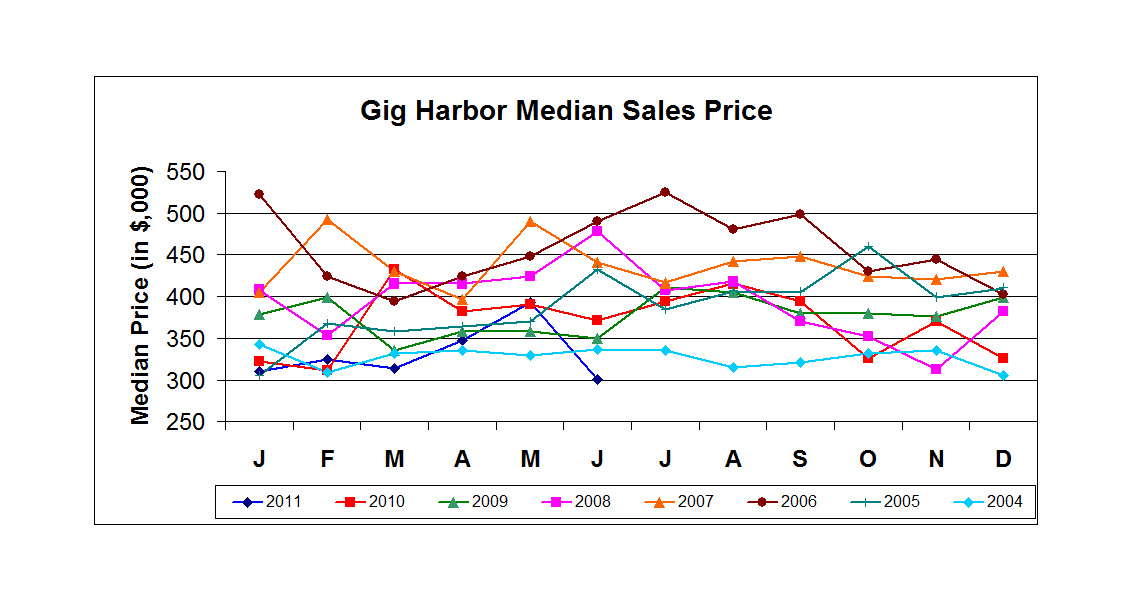
The graphs tell the story. In 2010 Gig Harbor home prices had a seven month run of improved prices over the year before, but prices plummeted in October, stayed down throughout the winter, bounced up in April and May but declined severely in June. Gig Harbor home prices are now at their lowest point in the last seven and one half years.

Gig Harbor home prices are down 10.5% for the second quarter from 2010 and down 23.4% from May. The10.5% decline speaks to how bad the market still in because the overall drop from the all-time high in 2006—five years ago–is 25%. Supply of homes, based on sales, has been holding in the 10 month range.

GH Med Sales Price - June 2011

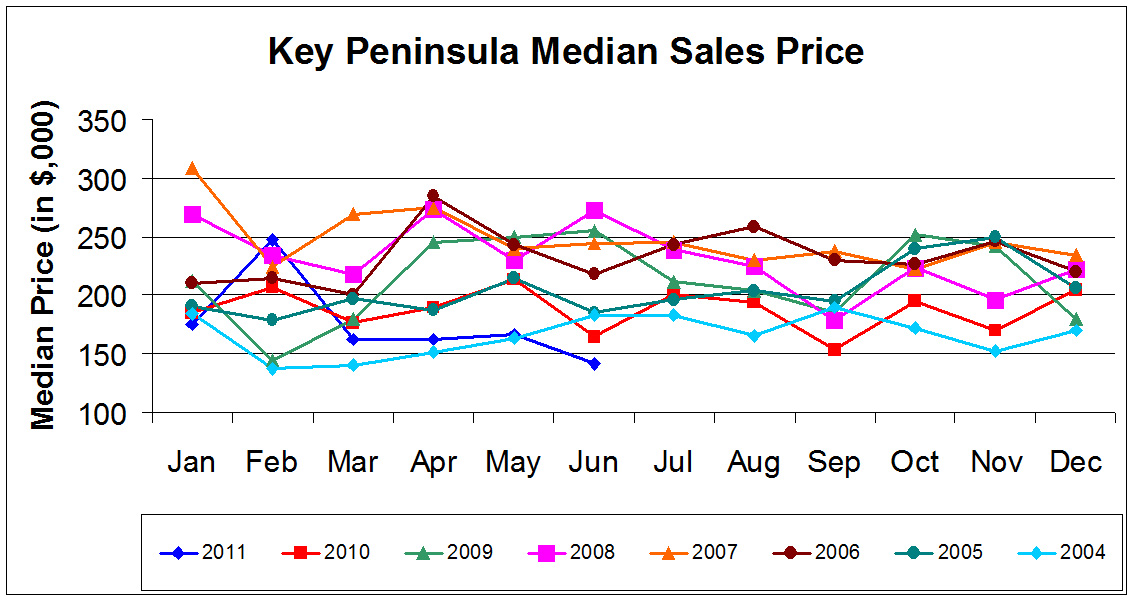
Key Peninsula didn’t fare any better. Responsible for a higher percentage of distressed sales, prices are down 16.4% for the second quarter from 2010 and 15% from May. Between 2006 and 2008 there was more price consistency in the market with some of the highs occurring in each of the three years. But June’s low is down 54% from the all-time high of January 2007.

All of the distressed home sales in Key Peninsula were bank-owned whereas the balance between bank-owned and short sales in Gig Harbor is more equal.

KP Median Sales price-June 2011


Closings in July will reflect the first month where a true comparison can be made between current and previous year sales. June 2010 was the last month to close on the loan for first-time buyer credit so last year’s sales were slightly higher in Gig Harbor but the same in Key Peninsula. I would expect the next few months will see sales easily surpassing 2010.

Second quarter news was consistently dismal—oil and food price increases, European defaults, weather, employment, and D.C.’s stalemate over the debt ceiling and deficit reduction. The economy couldn’t get any positive traction and lack of consumer confidence meant buyers were unwilling to buy unless they got a great deal. This is really a “buyer’s market.”

One glimmer of sunshine is that Seattle has seen some strong activity, some multiple offers in certain price ranges, and some price stabilization. As goes Seattle…so goes Gig Harbor, eventually.


Carole Holmaas is a Broker at Windermere Real Estate, licensed since 1967. She may be reached at 253.549.6611 or by Carole@ISellGigHarbor.com/

No responses yet

May 18 2011

Gig Harbor home prices drop to 2004 levels

Gig Harbor home prices drop to 2004 levels for the first four months of this year. Prices have clearly not stablized. The 15.4% drop from the same time last year is typical of Pierce county as a whole.

The Gig Harbor peninsula and Fox Island make up the data for Gig Harbor home prices.

May 2011 GH med. sales price

April showed improvement, posting the highest median sales figure since November. And the lower inventory is pulling down the supply of homes.

Distressed home sales–mostly bank-owned–represent roughly a third or more of all sales currently. This is applying downward pressure on Gig Harbor home prices. this figure is slightly higher than nationally reported data.

Zillow reported last week that house prices are falling at their fastest rate in over three years. Zillow predicts the market will not bottom nationally until 2012…something no Gig Harbor real estate professional will agrue with.

For buyers–it is great time to buy–mortgages are cheap and bank-owned deals are plentiful.


Carole Holmaas is a Broker at Windermere Real Estate, licensed since 1967.

No responses yet

May 09 2011

Gig Harbor home prices not yet stabilized

Gig Harbor home prices have clearly not yet stabilized as April data shows prices down 15.4% for the last three-month period from a year ago…but up from March. This $348,000 figure is the highest since November and uses the median sales price (half the sales above and half below).

Overall, Gig Harbor home prices are down 5.7% in the last one year compared to the one year period prior.  The Gig Harbor peninsula and Fox Island are included in data for Gig Harbor home prices.

Sales volume is right in line with last April and year-to-date figures—and the best since 2007.

Inventory is down nearly 20% from a year ago with an 11 months supply of homes on the market. This drop of listings correlates closely with the rest of the Puget Sound. Buyers in select price ranges may want to monitor that closely as a few areas have become seller’s markets.  The $200-250,000 range has only a four month supply and a couple mid to high-end ranges are in a balanced market condition.

Seattle Realtors are reporting they believe the bottom has been reached in that area’s homes priced under $350,000 and with a slimmer supply of good listings some upward pressure is being applied to home prices there. Gig Harbor home prices typically follow suit.

But sales above $800,000 have retrenched deeply in the past couple months as the economy has stumbled with only  one closing in April—for $2.1m—a deal that started as early as January. 

Distressed home sales—mostly bank-owned– represented a slightly smaller part of April’s closings—36% compared to 42% in March.  It is easy to see the downward pressure on Gig Harbor home prices with only 6% of listed homes bank-owned but 31% of all sales bank-owned properties.

Currently the national figure is about 30% of sales. Gig Harbor’s figures have continued to creep up over the past year.  According to the Case-Shiller Index, the Seattle/Bellevue/Everett area has about a 12.9 month supply of distressed homes to purge.  This represents the “shadow inventory” of homes in varying stages of delinquency and foreclosure as well as listed homes.

Carole Holmaas is a Managing Broker at Windermere Real Estate specializing in waterfront and view properties. She has been licensed since 1967. She maybe reached at 253.549.6611 or Carole@ISellGigHarbor.com.


No responses yet

Oct 25 2010

Gig Harbor home prices up 11.2%

Gig Harbor home prices up 11.2%

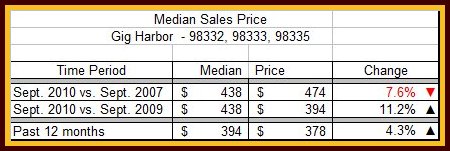
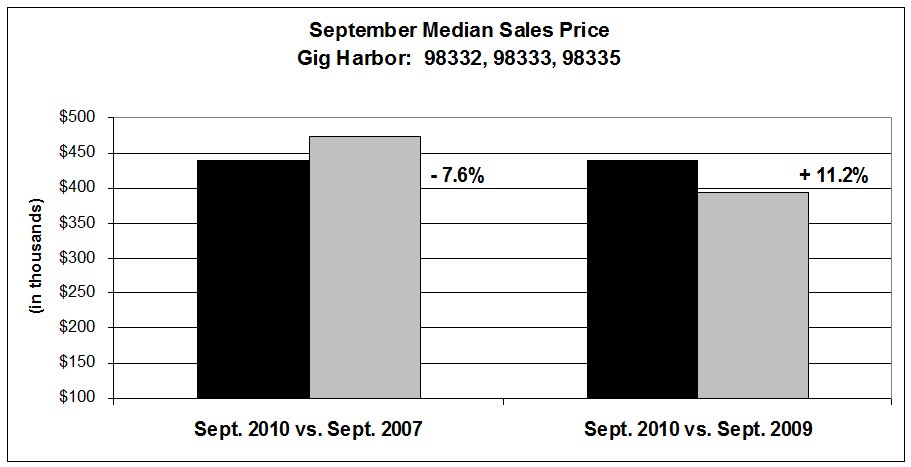
Median Gig Harbor home prices are up 11.2% from a year ago, to $438,000. Median sales price is the normal method used for trends—half the sales above $438,000 and half below $438,000. This is a better figure than Pierce County, as a whole, which trended downward just slightly in September.  These statistics represent the Gig Harbor peninsula, including Fox Island. My next blog posting will show what is happening with Key Peninsula home prices.

Even more encouraging than the year-over-year figure is Gig Harbor homes prices have trended up 4.3% over the past 12 months compared to the previous 12 months. The third quarter as a whole is also an improvement over both 2009 and 2008. These more comprehensive numbers indicate Gig Harbor home prices are making a gradual but steady climb out of the hole they were in a year ago.

 The chart shows the specifics of the changes in Gig Harbor home prices.


September Median Sales Price Table

Gig Harbor home prices


Noteworthy too, September recorded the highest median sales price of any month since June 2008—more than two years ago. Other than the 2008 date one had to look to 2007’s summer months to match or beat this September’s price.  

Sales ran the gamut—5 in Canterwood, 4 waterfront homes, 4 view homes, 4 condos, 4 in the new Chelsea Park neighborhood. The bulk of sales were in the $450-500,000 and $600-650,000 range, in addition to $250-300,000.

Sales volume is still slow—down from 2009 but nearly on a par with 2008—not yet great. There is currently a 13 month supply of houses on the market, based on September’s sales. That’s exactly what it was three years ago—September 2007–when the market turned downward–followed by 16 months often as high as 29 and 35 months supply.  A balanced market is between a 5-6 months supply.

September’s inventory of active listings is lower than it has been for this time of year. This low inventory might be giving us a false reading if there is a substantial amount of shadow inventory in the Gig Harbor market. Shadow inventory are homes foreclosed on by the lenders but not yet placed on the open market.


Sept. Median sales price 2007, 2010 chart

Gig Harbor home prices


Carole Holmaas is a Broker, licensed with Windermere Real Estate. She may be reached at 253.549.6611 or carole@ISellGigHarbor.com.

No responses yet

May 26 2010

Gig Harbor home prices show modest sustainability

Gig Harbor home prices show modest sustainability

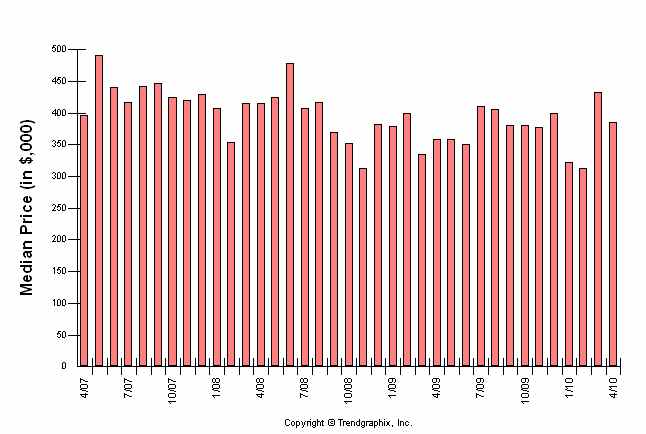
Gig Harbor home prices are continuing to sustain modest increases a third of the way into 2010, although down from March’s high of $432,000. It was evident that the March figure was an anomaly and could not be sustained; it reached back to prices the first half of 2007.

Gig Harbor home prices are up 7.2% to $385,000 over April 2009. April is the eighth of the last 10 months to show improvement year over year. Gig Harbor includes both the Gig Harbor peninsula and Fox Island.


Current 1 month     1 year     2 years  
Apr 10 Mar 10 % change   Apr 09 % change   Apr 08 % change

$385

$432

-11% ▼


$359

7.2% ▲


$415

-7.2% ▼

Prices are shown in $000’s

A wide spectrum of prices sold in April—over half below $400,000 but 27% of the sales were over $500,000, including two over $1million. I expect we will start to see higher Gig Harbor home prices as a more “normal” market takes over from the first-time buyer market dominating the last few months.

However I expect the number of sales to drop off some now that the first-time buyer incentive has expired. Sales of Gig Harbor homes have been better than 2009 for five of the last six monthsApril sales were up 34% over 2009 and 2008. Much of that activity was driven by first-time buyers as well as favorable interest rates.

With the global economy in distress, interest rates are now predicted to stay low for the remainder of this year. Unfortunately the substantial volume of foreclosures will continue to keep Gig Harbor home prices down—a trend likely to persist into 2011 or beyond.

Inventory continues to drop—last month down 4% from a year ago and 17% from two years.

The chart shown for Gig Harbor home prices includes both single family and condos.

 Gig Harbor Home Prices


Carole Holmaas is an Associate Broker at Windermere Real Estate and licensed since 1967. She may be reached at 253.549.6611 or Carole@ISellGigHarbor.com. Her posts on real estate conditions may be read at http://blog.ISellGigHarbor.com

No responses yet

« Prev