Archive for the 'Gig Harbor Real Estate' Category

Sep 01 2014

Gig Harbor home sales in “recovery mode”

Gig Harbor home sales in “recovery mode” 

In a nutshell—prices are up, inventory is under par, sales volume is down and the upper tier is appreciating. Now the details for Gig Harbor home sales year-over-year for the quarter…

Gig Harbor home sales down 16.5%

July itself is not usually a high sale volume month for Gig Harbor home sales (or any other area) with vacations. Only 2004 and 2013 were better in last 12 years, so in perspective, this is not bad.

The middle one-third of Gig Harbor home sales ($325-500,000) has predictably shown the least downturn in sales volume and the top one-third ($500,000 plus) has shown the least downgrade on number of contracts written (pending). Contracts written but not closed indicate current activity, thereby important because they show “move-up” activity as well as increased market strength and pricing for the higher tier.

Gig Harbor home sales “pending” down 14%

Pending sales for the quarter are down but shot up 14% from June, which is the experience local brokers have seen. Most central Puget Sound counties had the same experience.

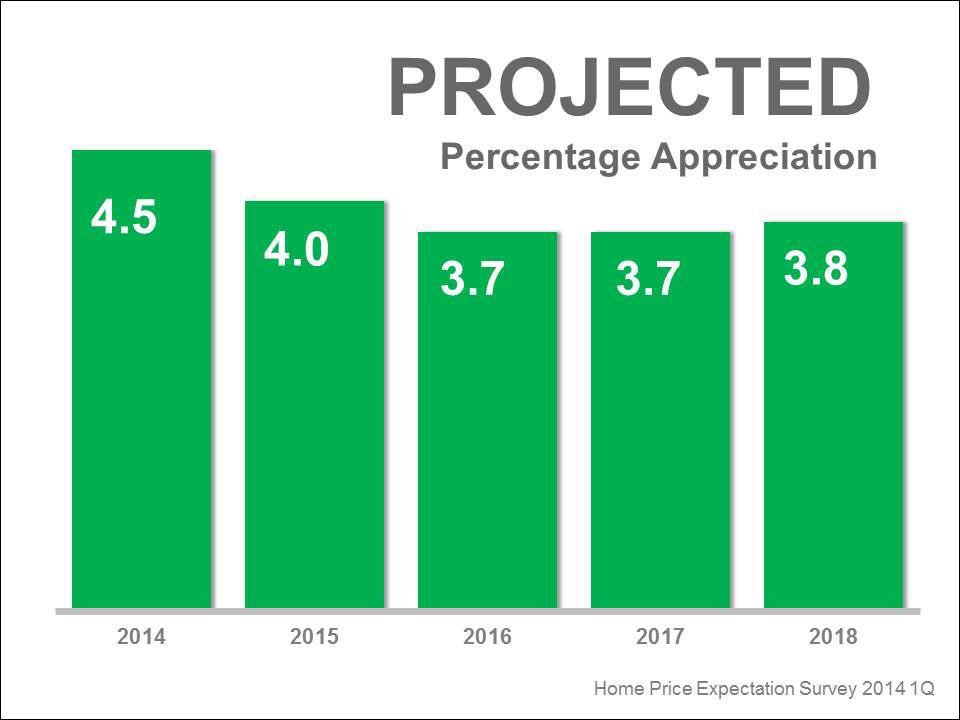
Prices for Gig Harbor home sales up 7.2%

The median price is appreciating–$387,000 for the quarter and $410,000 for July. July is also up 3.8% over June and up 25% year-over-year for the month. It has been gradually strength this year, after starting very low at $303,000 in January. This increase in prices for Gig Harbor home sales will encourage more sellers to list, adding the inventory the area badly needs.

We are down 18% from our 2006 third-quarter peak–or at summer 2005 prices. But at that time new homes made up as much as 40% of the sales, priced at $600,000 plus. The King/Pierce/Snohomish market as a whole is down 12.6% from the peak—the lower figure representing ever-strong metro King County.

Price increases are not exorbitant–just realistic appreciation. Brokers area-wide are saying sellers who overprice their homes face disappointing consequences.

Resale non-distressed appreciating

Sales prices have steadily been gaining since the first of the year–now at first-quarter 2006 prices $395,000.  August 2006 the peak–we are down 18% from the peak.

Inventory up 3%

Inventory is still low, which leads to multiple offers and homes selling above their list prices. Brokers throughout the Puget Sound point to the quality of some homes plus unrealistic pricing hindering sales. They say buyers often will not even look at a house they perceive to be over-market but just wait for a price reduction before viewing it.

New homes sales 10%

New construction has taken over 10% of all Gig Harbor home sales, down from 15% a year ago. But it represents 19% of all active listings,

Distressed sales 12%

This distressed market represents just 12% of Gig Harbor home sales—slightly less than the 14% in 2013. The single month of July was even better at just 6.5%.

Waterfront sales down

Sales volume is down significantly following the last 2 “makeup years”. Sales over $1m are running at just half-speed from those 2 years.

No responses yet

Sep 01 2014

Gig Harbor waterfront prices up 10%

Gig Harbor waterfront prices up 10%

Gig Harbor waterfront prices up 10%, January to mid-May, over the 2013 year. The entire price bump is coming from Gig Harbor and Fox Island—up 14% while Key Peninsula is experiencing a 7% decrease. Here are the highlights…

Sales volume for Gig harbor waterfront

  • On track for 100 sales by year-end—fairly typical
  • Slower thus far than 2013’s all-time high of 135
  • Sweet spot is $500-600,000, 4 closed/2 active listings
  • Also $400-500,000, 8 closed/14 listings
  • Also $900,000, 4 closed/8 listings

Median sales prices y-t-d for Gig Harbor waterfront

  • Prices ↑ 10% on both peninsulas over 2013 year–$550,000
  • Prices still ↓ 38% from 2007 peak
  • $1m+ represents 30% of listings—but just 11% of sales
  • $1m+ average 2 years on market before sale
  • Under $1m—average under 6 months on the market
  • Gig Harbor/Fox Island ↑ 14% over 2013–$713,000
  • Gig Harbor highest sale $2,960,000 after 6 ½ years
  • Key Peninsula ↓ 7%–$ 395,000
  • Key Peninsula highest sale $600,000 this year

Proposed Gig Harbor waterfront changes muddy the waters

The proposed all-new Shoreline Master Plan for Gig Harbor waterfront, mandated by the State, is proceeding cautiously—with local  hearings postponed by the Pierce County Council. The Council has chosen to push back against the State Department of Ecology on issues including buffers and aquaculture, but with the threat the State will impose more onerous regulations on shoreline properties if the Council can’t agree. The current 50 foot “setback” is proposed to change to a 75-150 foot “vegetative buffer.” And structural expansion into the “buffer” would be limited to 25% of the existing footprint, in most cases.

Every Gig Harbor waterfront owner should pay close attention to the current process and seek professional assistance, “sooner than later” if there is any thought of expanding, building or selling in the future.

No responses yet

Feb 26 2014

Cumulative House Appreciation 2014-2018


Cumulative House Appreciation 2014-2018.  The Home Price Expectation Survey 2014 1st Quarter was released last week by Pulsenomics. Pulsenomics surveys over one hundred economists, real estate experts and investment & market strategists asking them to project home prices. This includes three graphs for the national scene, projecting the highest this year and slightly lower the following four years.


Slide2


  1. The pre-bubble trend
  2. The 25% most optimistic experts (bulls)
  3. All projections
  4. The 25% most pessimistic experts (bears)

Slide3

And then, some indications historically of where annual appreciation sits:

Slide1

No responses yet

Feb 16 2014

Gig Harbor waterfront 2013’s sales volume up 33%


Gig Harbor waterfront 2013’s sales volume was up 33% year-over-year.  April through October posted nearly identical volume each month—14 or 15 homes closing each month.  And the number of sales every month was the highest for Gig Harbor waterfront it had been for at least a decade.


Gig Harbor waterfront 2013’s strong activity was due to a nearly “perfect storm” of buying conditions…historically low interest rates the first half of the year, a fair amount of inventory available with pent-up seller demand, easier lending requirements, and the buyers’ realization the market had bottomed. However, the very high tier—over $1million– dropped off precipitously with no Gig Harbor waterfront contracts written after the end of August. This followed the nation-wide fall-off of all price ranges in 4th quarter. This very high-end represented just 10% of all sales—the lowest percentage we’ve seen since 2004.


        Median sales price 2006-2013 Gig Harbor Waterfront

Yr  Sales Price    % Chg    $1.5m+   $1m+   Total Sales     % $1m+

‘06       850,000                                13         10           66                 35%

‘07       900,000           ↑6                 6          17            64                 36%

‘08       800,000           ↓11               3          11             52                 17%

‘10       662,000           ↓3                 2          15            67                 25%

‘11       525,000           ↓20               2            7            70                 13%

‘12       565,000           ↑8                 4          10           101                14%

‘13       490,000          ↓13               5            9           135                10%


  • Gig Harbor waterfront sales prices reached their peak in 2007. Prices have dropped 46% since then–now residing where they were in 2003-2004.
  • The current slim inventory of Gig Harbor waterfront—coupled with still relatively low interest rates and easier financing could mean improving prices for sellers in 2014. On the other hand, if pent-up sellers place a surge of homes in the marketplace, it could continue to hold down prices. I believe there is a minimum of 250 waterfront owners who are ready to move—if market conditions (prices) will permit.
  • Gig Harbor waterfront homes selling above $1m sold on average for 150% of their assessed value in 2013. Average waterfront was 170 feet.  Nearly all faced West or Northwest, 3 had docks, and 8 were low or no-bank…nothing unusual here.
  • Homes selling from $750,000-1,000,000 were on average 120% of their assessed value. Sites here averaged 136 feet, slightly more than half faced north or east, most the rest south.
  • Gig Harbor waterfront distressed home sales were down—just 9% of the sales last year were short-sales and 4% were bank-owned. This is a great reduction from two years ago at 9% and 13% respectively. The most expensive bank-owned house sold for $875,000 on Fox Island.
  • There may be a window of opportunity for Gig Harbor waterfront  sellers now in early spring to take advantage of low inventory and buyers before more sellers enter the marketplace.

No responses yet

Jan 26 2014

Gig Harbor home sales annual review—strictly resale

Jan graph

Gig Harbor home sales


Gig Harbor home sales annual review—strictly resale. This may surprise you but 2nd quarter 2013 and 3rd quarter 2012 realized median sales prices near the 2006 peak of $425,000. This is “strictly resale” homes—not bank-owned nor short-sales.

Today’s graph of Gig Harbor home sales shows resale, new and bank-owned sales plus the resale trendline, by quarter, from $400,000 in 2005 to $370,000 today.  Resale is now off just 13% from its peak and only 7.5% from its trendline. Sale prices performed well in the first half 2013…but removed much of those gains in the second half…performing at 2005 prices.This is true of all Gig Harbor home sales.

More stats on the resale market

  • Current $370,000 sales price is considered neutral, based on a 6-quarter trend
  • Sold-to-listing price ratio  is up to 94% from 89% a year ago
  • With 40-55% of 2006-07 sales new large homes, this pulled up the sales price overall above $450,000 —  just as bank-owned sales pulled it down below $325,000

I offer some observations…positive and negative for Gig Harbor home sales

  • The recent Boeing contract and high tech industry will produce a more robust housing market than much of the rest of the nation
  • Interest rates will likely  climb to 5.4% by year’s end and lending will be less supportive to a housing recovery
  • Income growth will continue very slowly. This is the deepest and longest employment “recovery” we have experienced since the Depression
  • Investors have pulled back from buying homes, creating part of the slowdown in sales since summer
  • Inventory will stay low until sellers can retrieve more of their equity—higher sales prices. Nationally 13% of homeowners owe more than their home is worth. Washington is 11th for foreclosure filings, bucking the national trend
  • Puget Sound sales volume has dropped the last 3 months after all 2013’s earlier months topped the charts
  • January 10’s tighter underwriting standards will keep more first-time buyers renting


No responses yet

Jan 26 2014

Gig Harbor resale home prices down just 5.1% over peak

Gig Harbor resale home prices down just 5.1% over peak. Stripping out new home and distressed home sales, Gig Harbor resale prices are actually down just 5.1% from the 2006 peak. Hopefully this week’s graph will provide some perspective for sellers as they contemplate marketing their home in 2014. The numbers show Gig Harbor resale prices down 21% from its boom but that figure includes distressed sales and new home prices that outpaced the rest of the market by $150,000-300,000 at the peak.  New homes were much larger than the product being built today in Gig Harbor North. All sales combined are up 6.3% over a year ago.

A caveat – Competition for any home sale depends on the options available to the buyer at that time. It is one thing to compete in a market with a 2-year supply of homes and 50% of it distressed compared to a 4-month supply of homes with only 10% distressed currently.

While first quarter 2013 was the low point for combined Gig Harbor sales prices, this entire year has been the highest (with an exception in early 2010) since first half 2008 for Gig Harbor resale prices itself.

Inventory is down 47% from first half 2008 high. Gig Harbor hasn’t experienced low inventory since 2004-05. This is why brokers routinely urge sellers to consider marketing early in the year – traditionally a low inventory period, producing faster sales and higher prices.

Dec graph

Gig Harbor resale prices

No responses yet

Jan 26 2014

Gig Harbor home prices and sales pause in October

Gig Harbor home prices and sales pause in October

Pending sales volume during October was level with 2012 sales as well as September’s.  The higher tiers have seen fewer contracts and closed sales in the past two months.

The consensus is the federal shutdown during the first two weeks of October, the unknown of the Affordable Health Care law and below-normal inventory has shaken consumer confidence.

Consumer confidence “deteriorated considerably” in October as a result of the shutdown and debt ceiling squabbles, according to The Conference Board. A recent Gallup poll found some improvement in Americans’ economic confidence, but reported it is still well below mid-September, before the shutdown

MLS figures summarizing October’s activity show year-over-year drop in inventory (down 10% in Gig Harbor and 20% in Key Peninsula), nearly 20% increase in the volume of closed sales, and healthy increases in selling prices (up 9.4% in Gig Harbor and 5.9% in Key Peninsula).

Gig Harbor’s median price of $350,000 is 9.4% higher than a year ago – 12.9% lower than September – essentially the same as first half 2005 prices. First half November Gig Harbor home prices are also lower.

  • As of Nov 17, $285,000 is the median Gig Harbor home price for closed sales
  • Gig Harbor home prices are running at 1st half 2005 prices
  • Key Peninsula’s median price of $216,000 is 5.9% higher than last year & the same as September
  • As of Nov 17, $183,000 is the median for closed sales this month
  • Prices are running at 2nd half 2005 prices
  • Nationally house prices are expected to increase 4.3% in 2014 and settle around 3.4% after that
  • October homes closed at 99% of then current list price. November is seeing a slight tick down from that and slightly longer market time
  • Inventory is down 10% for Gig harbor and nearly 20% for Key Peninsula

No responses yet

Dec 12 2013

Top design trends

The Year's Best Décor Trends…something to consider since more of us are staying in our homes and remodeling.

http://bit.ly/18v48dw

No responses yet

Nov 12 2013

Importance of Curb Appeal %5BINFOGRAPHIC%5D

No responses yet

Nov 07 2013

Real Estate Post Sandy Proves ‘Jersey Strong’

http://bit.ly/1cJOhdT

No responses yet

« Prev - Next »